Documentation
Welcome to the sysAgent.ai documentation. This guide will help you set up, configure, and maximize the value of the ultimate Multi-OS System Administrator Agent.
Our platform combines traditional infrastructure monitoring with generative AI to give you a single, intelligent control plane for your entire fleet:
- Unified multi-OS management: Native support for both Linux (Ubuntu, Debian, CentOS, RHEL) and Windows (Server 2016+, Windows 10/11) from one dashboard, with real-time telemetry collected via procfs and WMI.
- AI-driven operations: Execute tasks in plain English (auto-translated to Bash or PowerShell), open live browser-based terminals, and let Autonomous Operations plan and run multi-step jobs with full transparency and approval gates.
- Proactive monitoring & self-healing: Build no-code monitoring checks, forecast outages with Predictive Analytics (disk, CPU, and memory), and resolve recurring incidents automatically with Auto-Remediation rules, on-call schedules, and maintenance windows.
- Security & compliance: Run hardening scans (OpenSCAP), CVE vulnerability detection, SSL certificate discovery with expiry alerts and replacement, File Integrity Monitoring, and generate audit-ready compliance reports (SOC 2, ISO 27001, HIPAA, DORA, NIS 2).
- Automation & insight: Generate OS-tailored Ansible playbooks, provision cloud infrastructure with AI-generated Terraform (AWS, GCP, Azure, VMware), optimize configuration files with AI, visualize dependencies on the AI Map, and auto-produce living infrastructure documentation.
- Enterprise-ready governance: Granular Role-Based Access Control, 2FA, Single Sign-On (SAML & OIDC), a full audit trail, and flexible notification channels keep operations secure and accountable.
Getting Started
1. Registration
First, create an account on our cloud platform. You will be assigned a unique Organization ID.
During login, you can optionally enable Two-Factor Authentication (2FA) for enhanced account security. We also offer granular Role-Based Access Control (RBAC), allowing you to define precise permissions for every system function and user.
2. Adding hosts
Once registered, open the Add Hosts view from the Add host button on the Agent Operations page. It is the single place to onboard a machine and offers two methods:
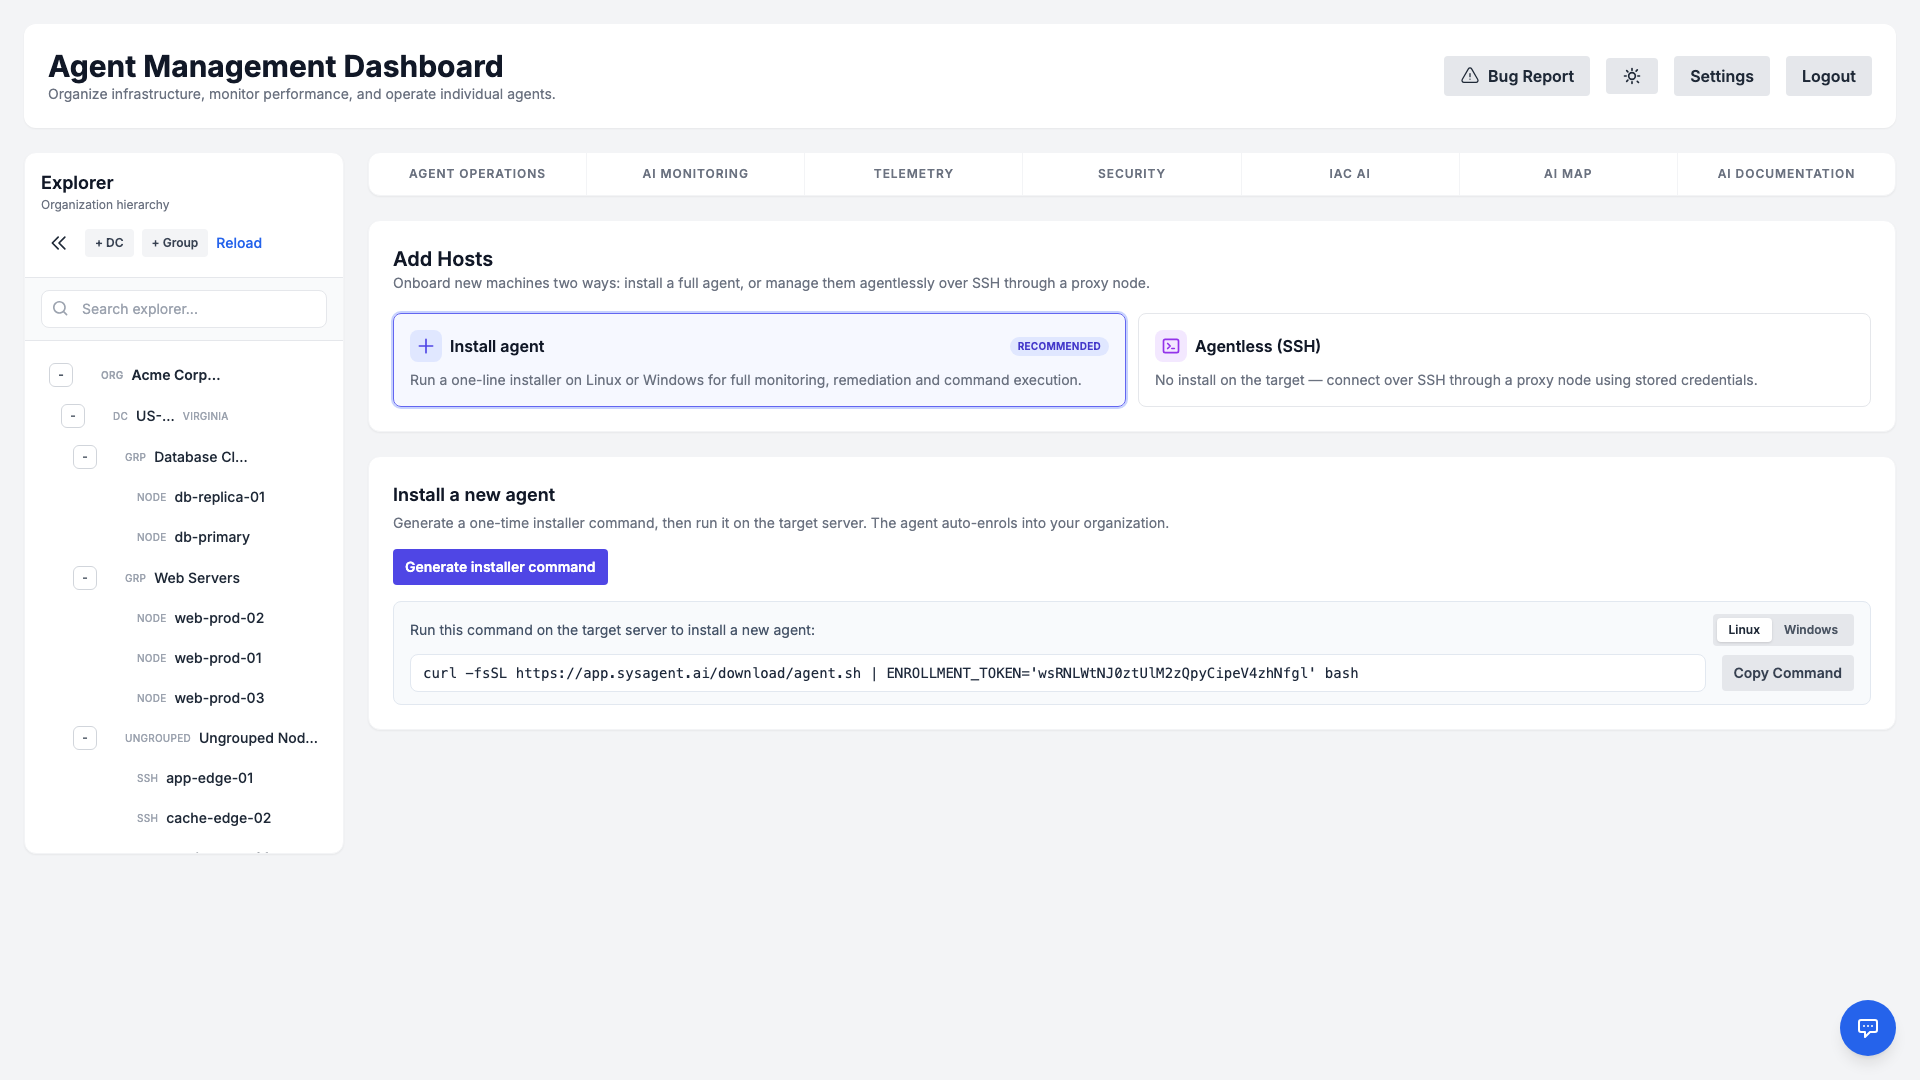
- Install agent (recommended) — generate a one-line installer command and run it on the target server for full monitoring, remediation, and command execution. The dashboard provides quick-copy commands for both Linux (Bash) and Windows (PowerShell), and the agent auto-enrols into your organization.
- Agentless (SSH) — manage a Linux server over SSH through a proxy node, with no software installed on the target (see Agentless SSH Hosts).
For Linux (Ubuntu, Debian, CentOS, RHEL)
curl -sSL https://app.sysagent.ai/download/agent.sh | sudo bash -sFor Windows (Server 2016+, Windows 10/11)
Invoke-WebRequest -Uri "https://app.sysagent.ai/download/agent.ps1" -OutFile "$env:TEMP\agent.ps1"; & "$env:TEMP\agent.ps1"Agentless SSH Hosts
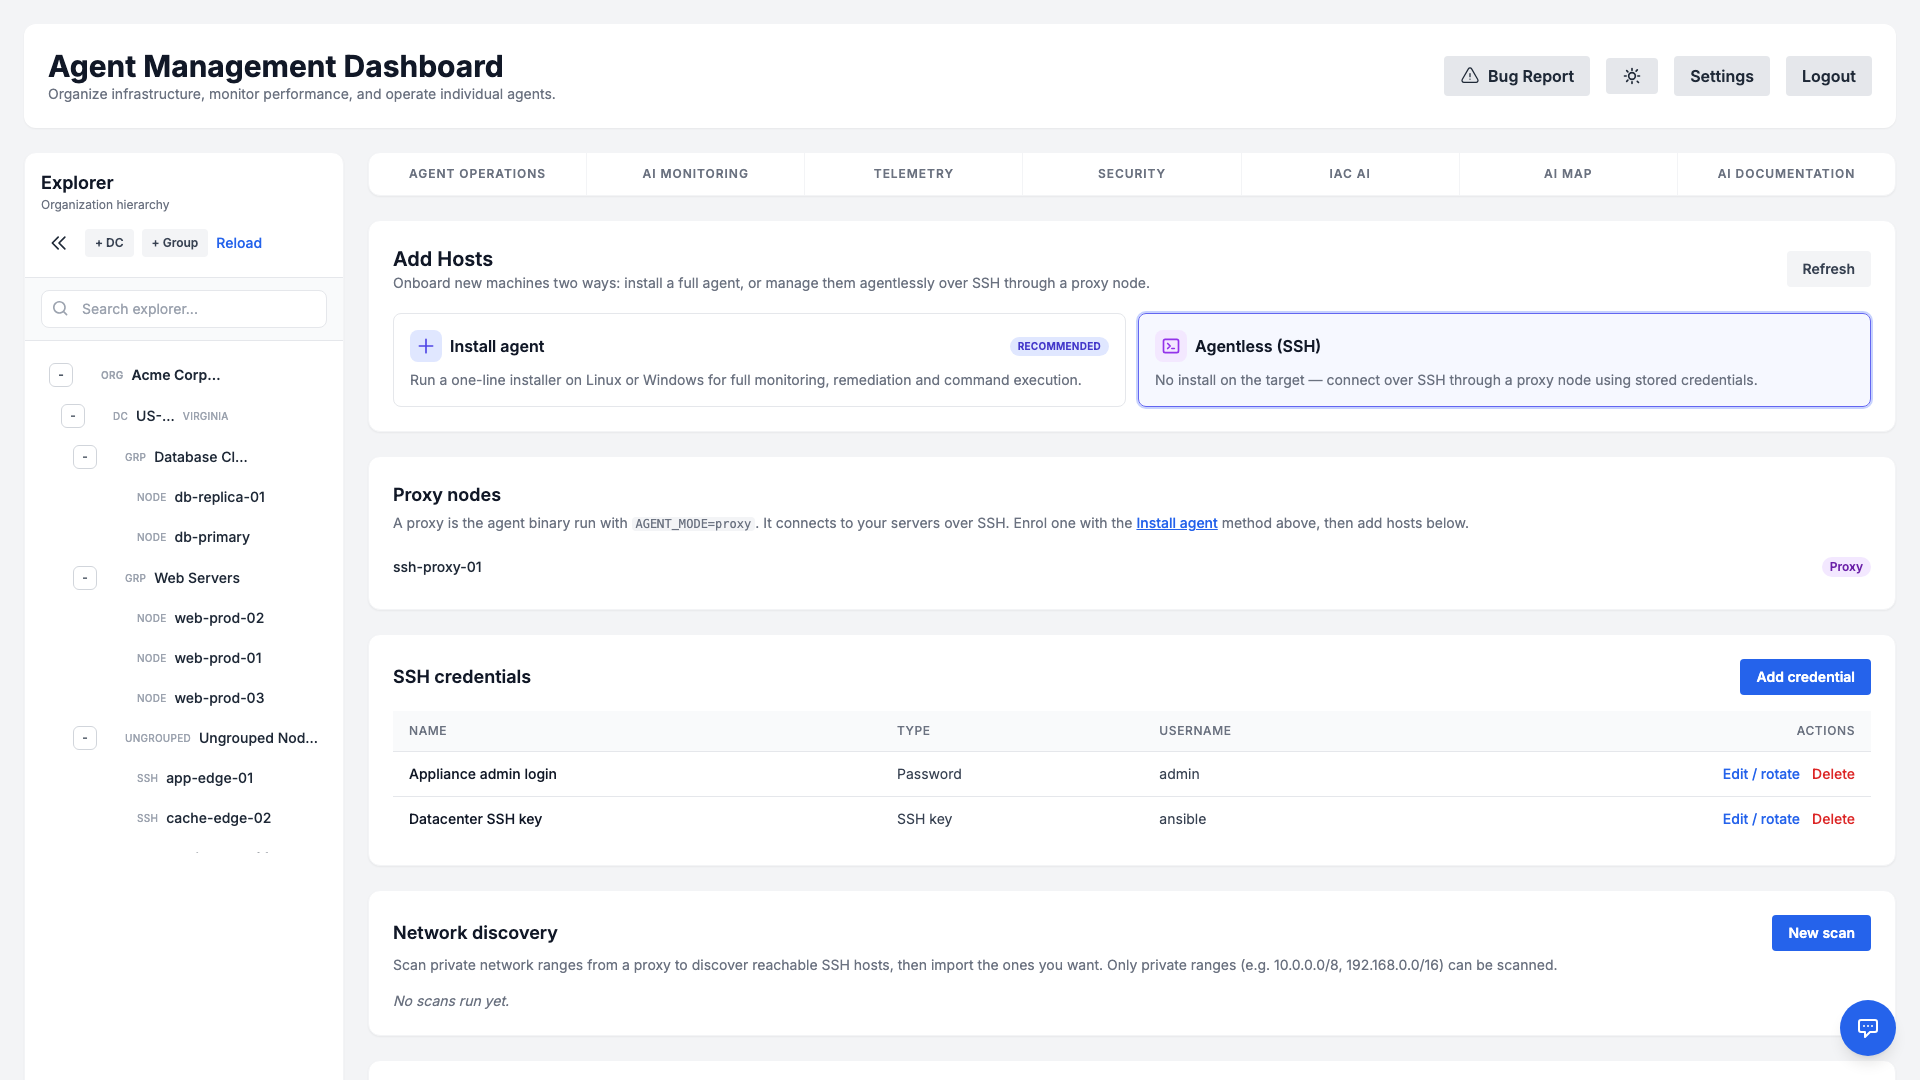
Not every server can run a local agent — appliances, locked-down hosts, or machines you simply prefer to manage over SSH. Agentless mode is the second onboarding method in the Add Hosts view (open it from the Add host button on the Agent Operations page, then choose Agentless (SSH)). It lets you manage those Linux servers through a single proxy node that reaches them over SSH (key or password). Once a host is connected, the platform's existing capabilities — command execution, telemetry & predictive analytics, monitoring checks, File Integrity Monitoring, CVE scanning, SSL discovery, OpenSCAP, Ansible playbooks, and the live interactive terminal — all work over SSH, with no software installed on the target.
How it works
A proxy is the ordinary agent binary started in proxy mode inside your network. It keeps a single outbound, encrypted connection to the manager and connects onward to your servers over SSH. Each agentless host is recorded in inventory and routed through its proxy; the manager decrypts the host's SSH credential only at dispatch time and delivers it to the proxy over the already-encrypted manager↔proxy channel — it is never written to disk in plaintext and never returned to the browser.
Commands run on the target host through the proxy, exactly like an installed-agent host — so features that need extra tooling on the host (for example OpenSCAP or Ansible) require that package on the host, just as they would for a normally-enrolled server.
1. Deploy a proxy
Install the agent on a small Linux VM or container inside the network that can reach your servers, and start it in proxy mode:
AGENT_MODE=proxy /opt/sysagent/agentThe node registers itself and appears under Proxy nodes in the Add Hosts → Agentless (SSH) view.
2. Add an SSH credential
In Add Hosts → Agentless (SSH) → SSH credentials → Add credential, store either an SSH private key (with an optional passphrase) or a password, plus the login username. Secrets are encrypted at rest and are write-only — the credential list only ever shows the name, type, and username, never the secret. A credential belongs to one organization and can only be attached to hosts in that same organization. You can later rotate a credential's secret in place from the same screen; every host using it keeps working with the new secret, with no re-assignment.
3. Add hosts
You can register hosts two ways:
- Manually — in Add Hosts → Agentless (SSH) → Agentless hosts → Add SSH host, pick the proxy and credential and enter the host address, port, and username.
- By network discovery — in the Network discovery section, choose a proxy and enter one or more private network ranges (CIDR) and ports. The proxy performs a bounded, read-only TCP scan and returns the reachable SSH hosts; select the ones you want and import them in bulk with a chosen credential. Only private (RFC‑1918 / CGNAT / ULA) ranges can be scanned — public and infrastructure ranges are refused — and the scan is size-bounded so it can never become a network-stress tool.
Security
Agentless management is built defence-first:
- Encrypted credential vault. Keys and passwords are stored encrypted, never logged, and masked in every API response; reads are organization-scoped.
- Host-key pinning (anti-MITM). On first contact the proxy records and pins the host's SSH key fingerprint (trust-on-first-use) and refuses to connect if it later changes. If a host is legitimately reinstalled or rekeyed, an administrator explicitly resets the pinned key (an audited action) so the next connection re-pins the new one — a silently changed key keeps failing until a human intervenes.
- SSRF-safe targeting. Connection and scan targets are validated against a deny-list (loopback, link-local, cloud-metadata, multicast, and similar ranges are refused) before any credential is sent.
- Strict multi-tenant isolation. A host, its proxy, and its credential always share the same organization; a proxy can never be routed to another tenant's host, and every action (add, scan, import, rotate, reset) is recorded in the audit log.
- Least privilege. Managing proxies, credentials, hosts, and scans requires a privileged administrator session.
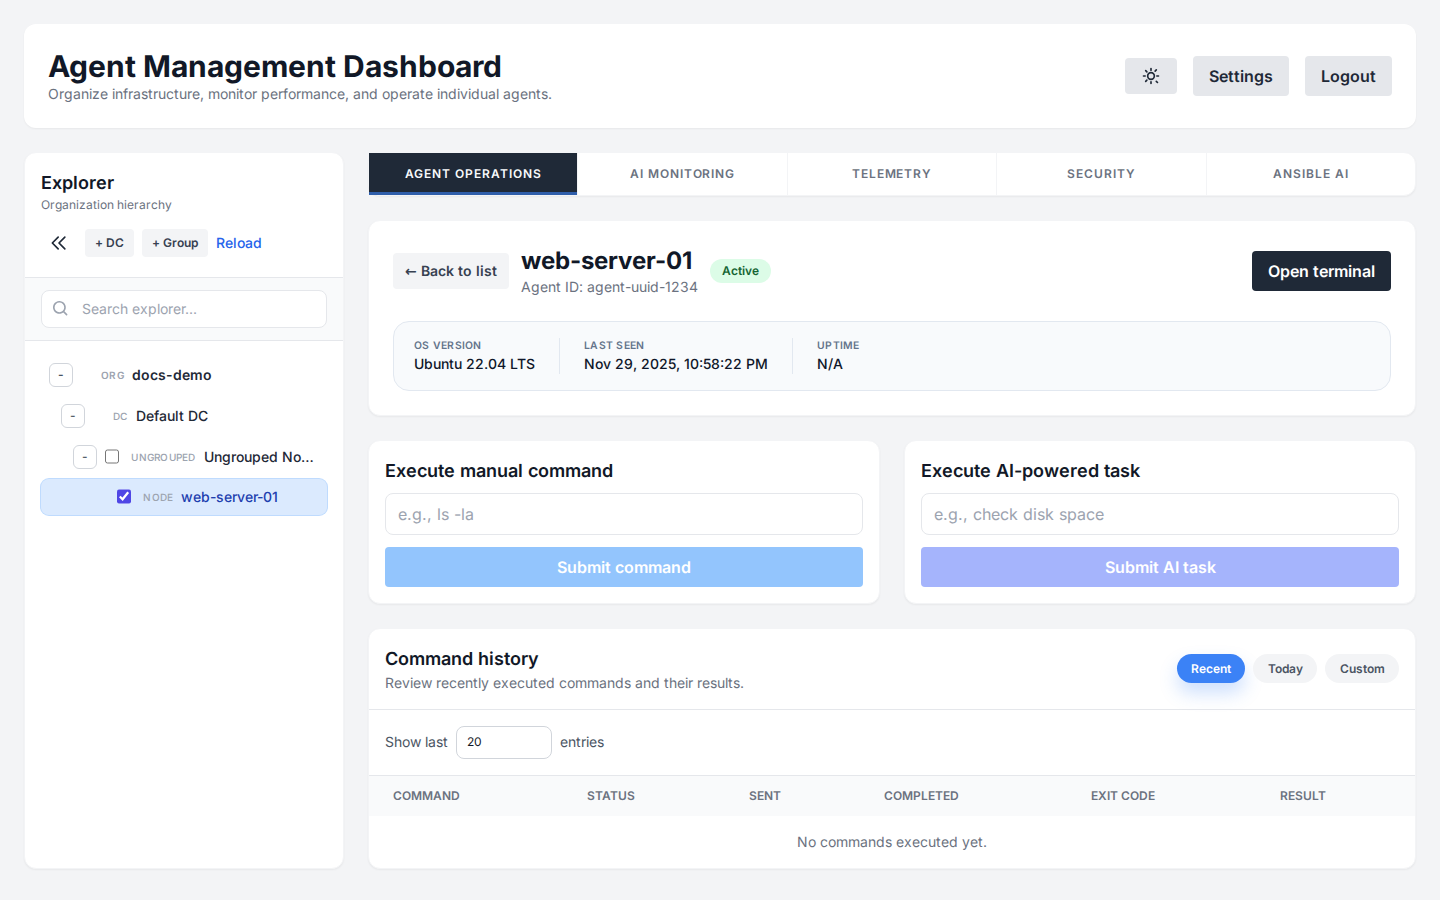
Dashboard Overview
The main dashboard provides a birds-eye view of your infrastructure. You can see real-time metrics for CPU, Memory, Disk I/O, and network activity across your entire fleet.
The Explorer panel on the left allows you to organize your fleet. You can create Datacenters and Machine Groups to structure your servers logically. To interact with or view details for any specific server or group, simply click on it in the Explorer tree.
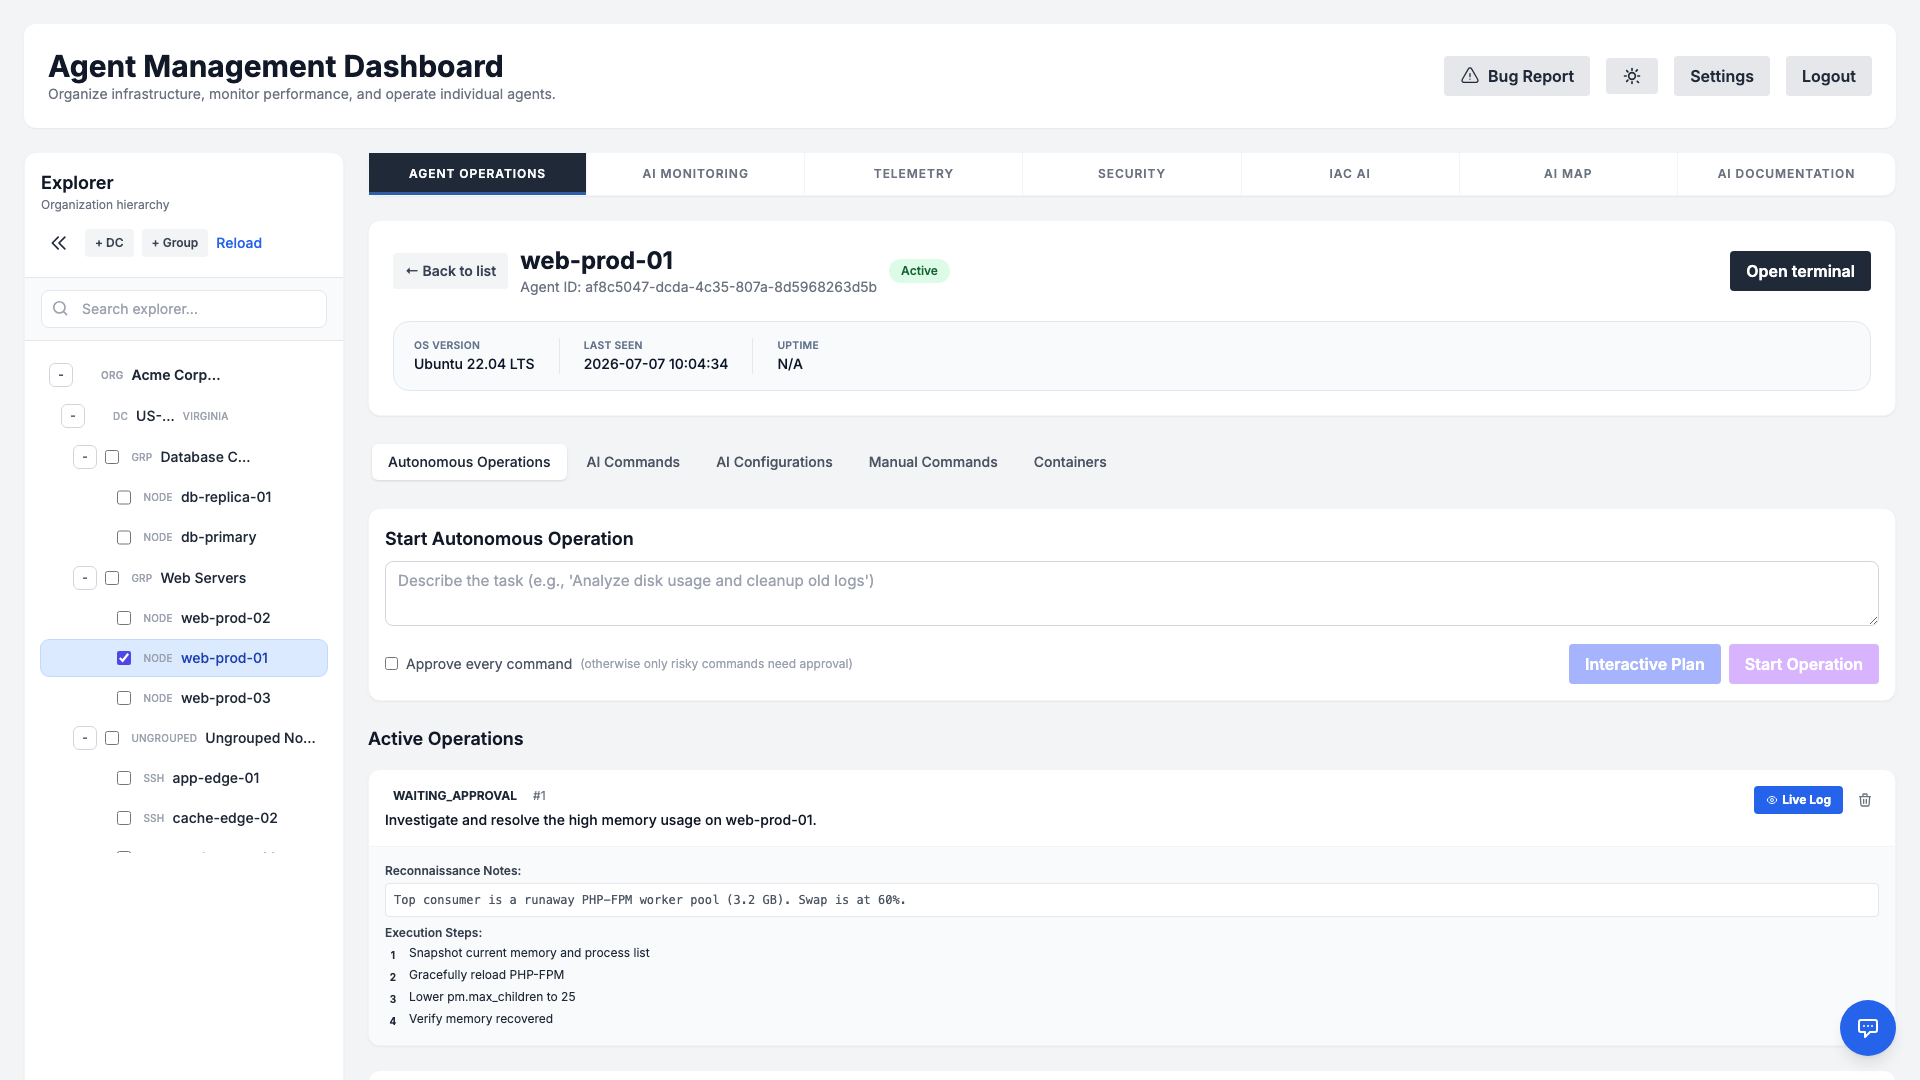
Autonomous Operations
Autonomous Operations let the AI plan and execute multi-step tasks on a server with full transparency and human oversight. Describe a goal in plain English — for example, "Analyze disk usage and clean up old logs" — and the agent breaks it into discrete, ordered steps.
How it works
- Step-by-step plan: Each operation is decomposed into individual steps, each with its own command, status, and output.
- Approval gates: Operations can pause in a
WAITING_APPROVALstate so an administrator reviews the plan before any change is applied. - Live progress: Watch steps move through
PENDING,RUNNING, andCOMPLETEDstates in real time. - Safe by design: Operations respect maintenance windows and RBAC permissions, and every action is recorded in the audit log.
Interactive Plan vs. Start Operation
After you describe a task, two buttons let you choose how much you stay in the loop:
- Interactive Plan — Opens a conversational planning session with the AI before anything runs on the server. The agent proposes a plan, and you can chat back and forth — refine the goal, add constraints, ask questions, and adjust steps — until the plan is exactly what you want. Nothing is executed until you explicitly confirm the finalized plan. Choose this for complex, unfamiliar, or higher-risk tasks where you want to shape the approach first.
- Start Operation — Launches the operation immediately. The AI analyzes the goal, generates the full step-by-step plan, and begins executing it (still honoring any approval gates, maintenance windows, and RBAC checks). Choose this for routine or well-understood tasks where you trust the agent to plan and proceed on its own.
In short: Interactive Plan is a "review and refine together first" workflow, while Start Operation is a "plan and go" workflow. Both produce the same kind of transparent, auditable, step-by-step operation — they differ only in how much you collaborate on the plan up front.
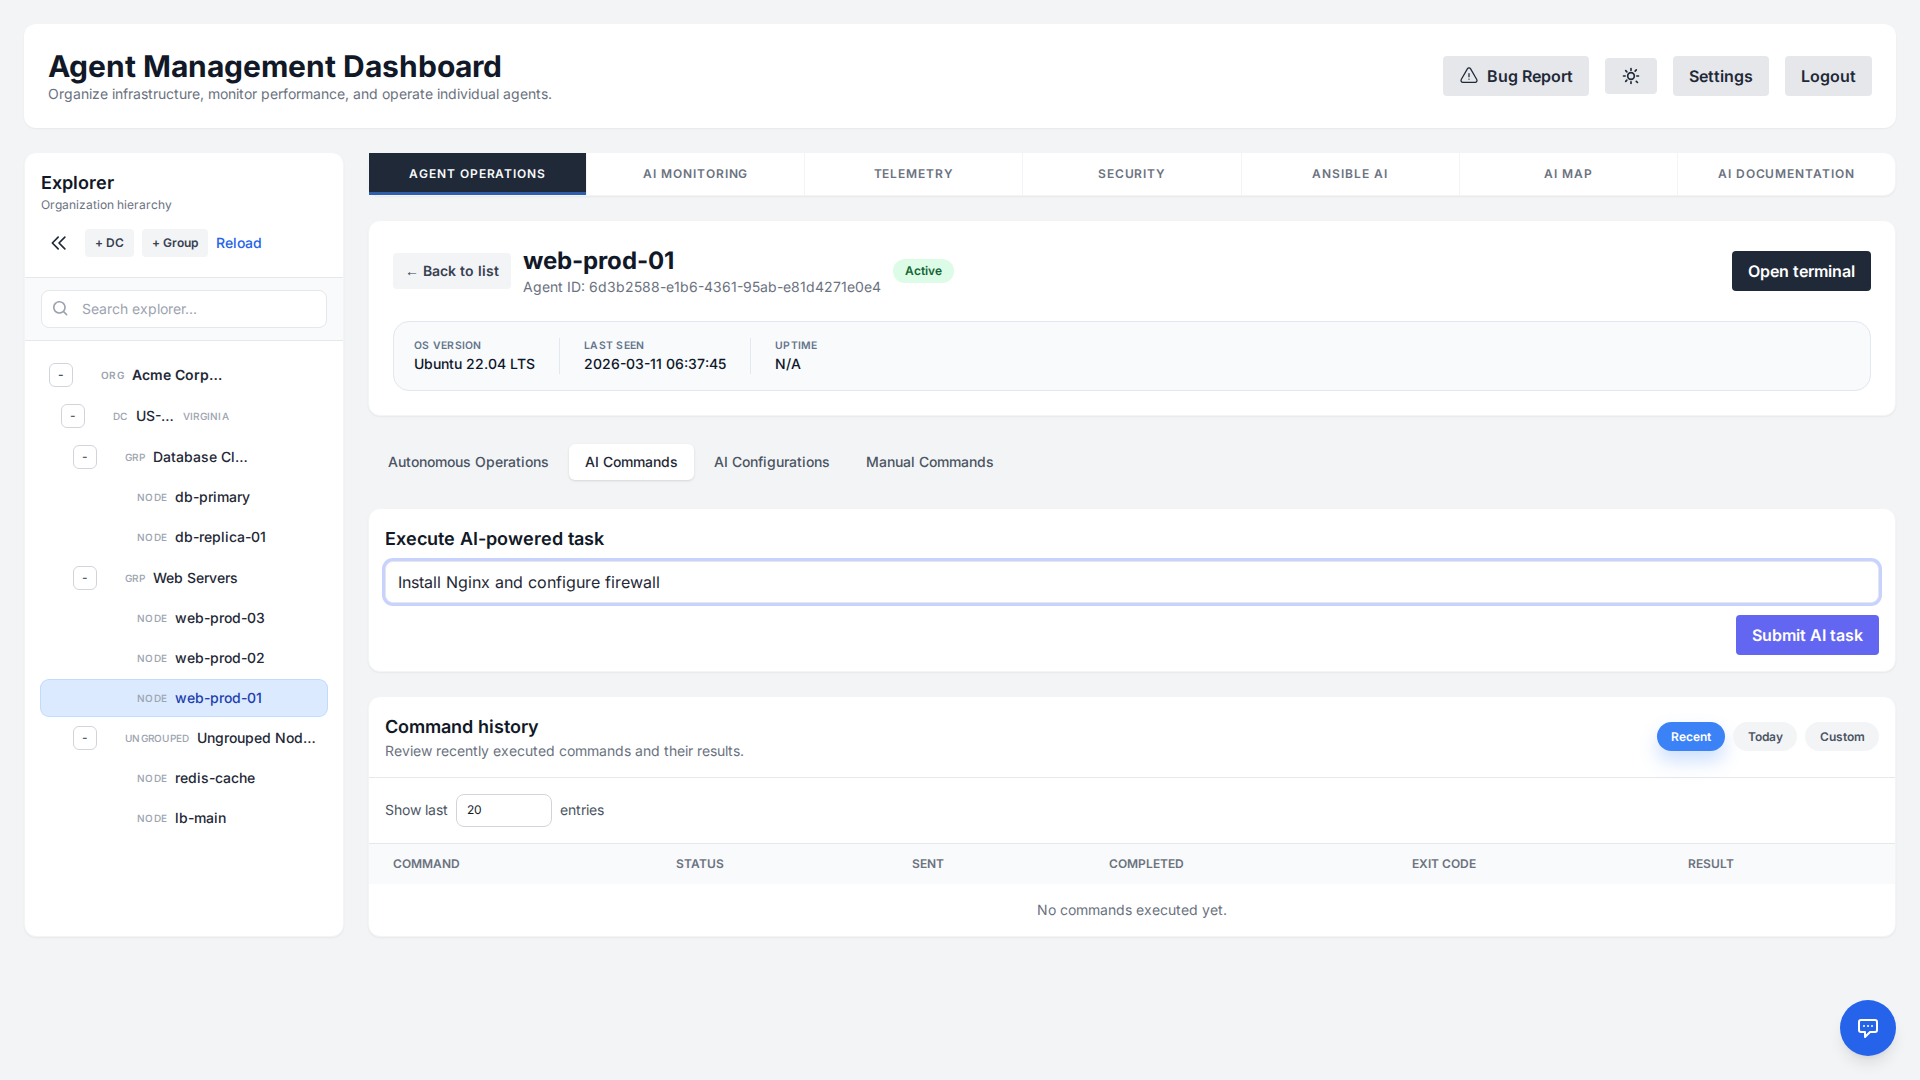
AI Command Execution
Interact with your servers using natural language. The "Execute" tab provides a chat interface where you can ask the agent to perform tasks. The AI automatically detects the target OS and generates Bash or PowerShell commands accordingly.
Example prompts:
- "Find the process consuming the most memory and kill it."
- "Check if the IIS/Nginx service is running and restart it if not."
- "List all large files in C:\Logs or /var/log."
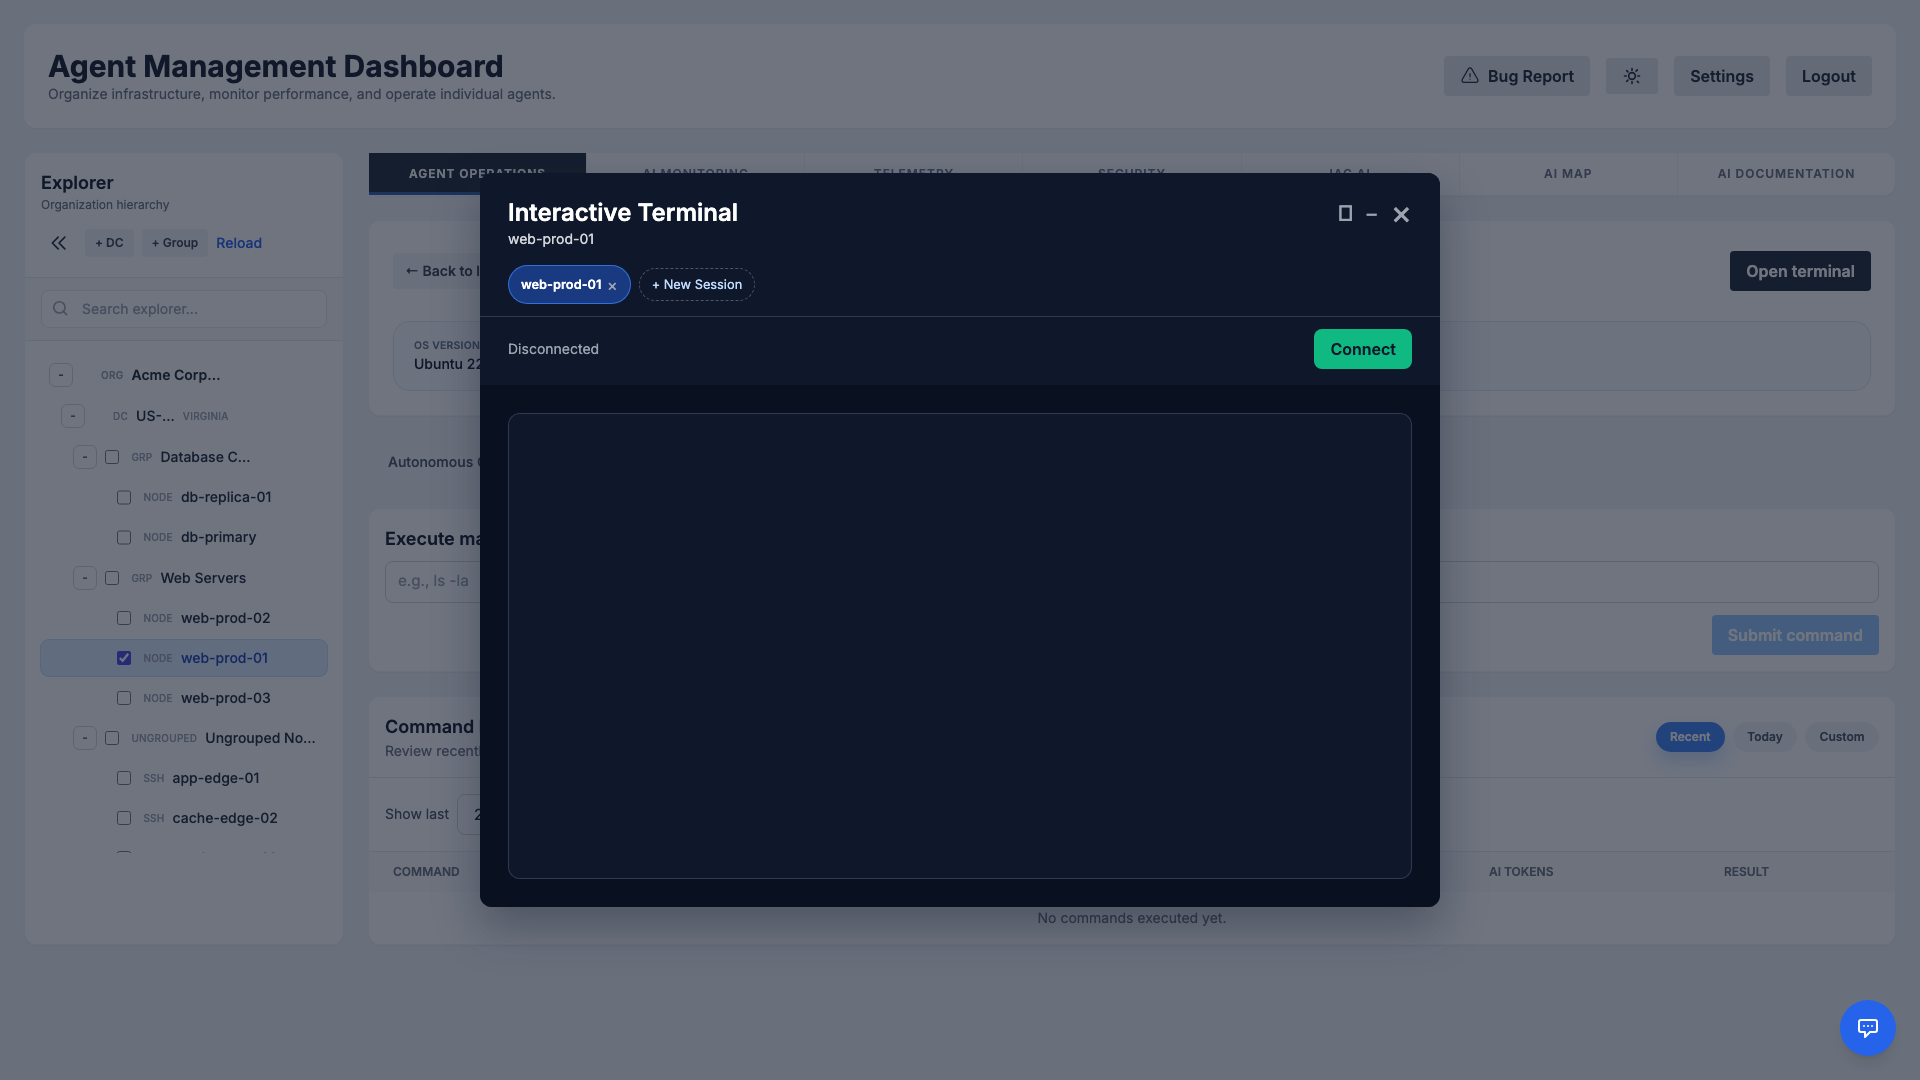
Open Terminal
For direct, low-level access, use the Open Terminal feature. This opens a fully interactive session to your server directly in the browser, functioning equivalently to a standard SSH or PowerShell Remoting connection.
Advanced AI Planning
For complex tasks, the AI doesn't just execute commands blindly. It enters a Planning Mode to create a structured execution strategy.
Key Features
- Sequential vs. Parallel: The AI intelligently determines if tasks must be run in order (e.g., install -> config -> restart) or can run simultaneously to save time.
- Stop on Failure: You can configure the plan to halt immediately if a critical step fails (
stop_on_failure: true), preventing cascading errors. - Clarification: In "Deep Planning Mode", the AI will ask you questions to validate assumptions before generating any commands.
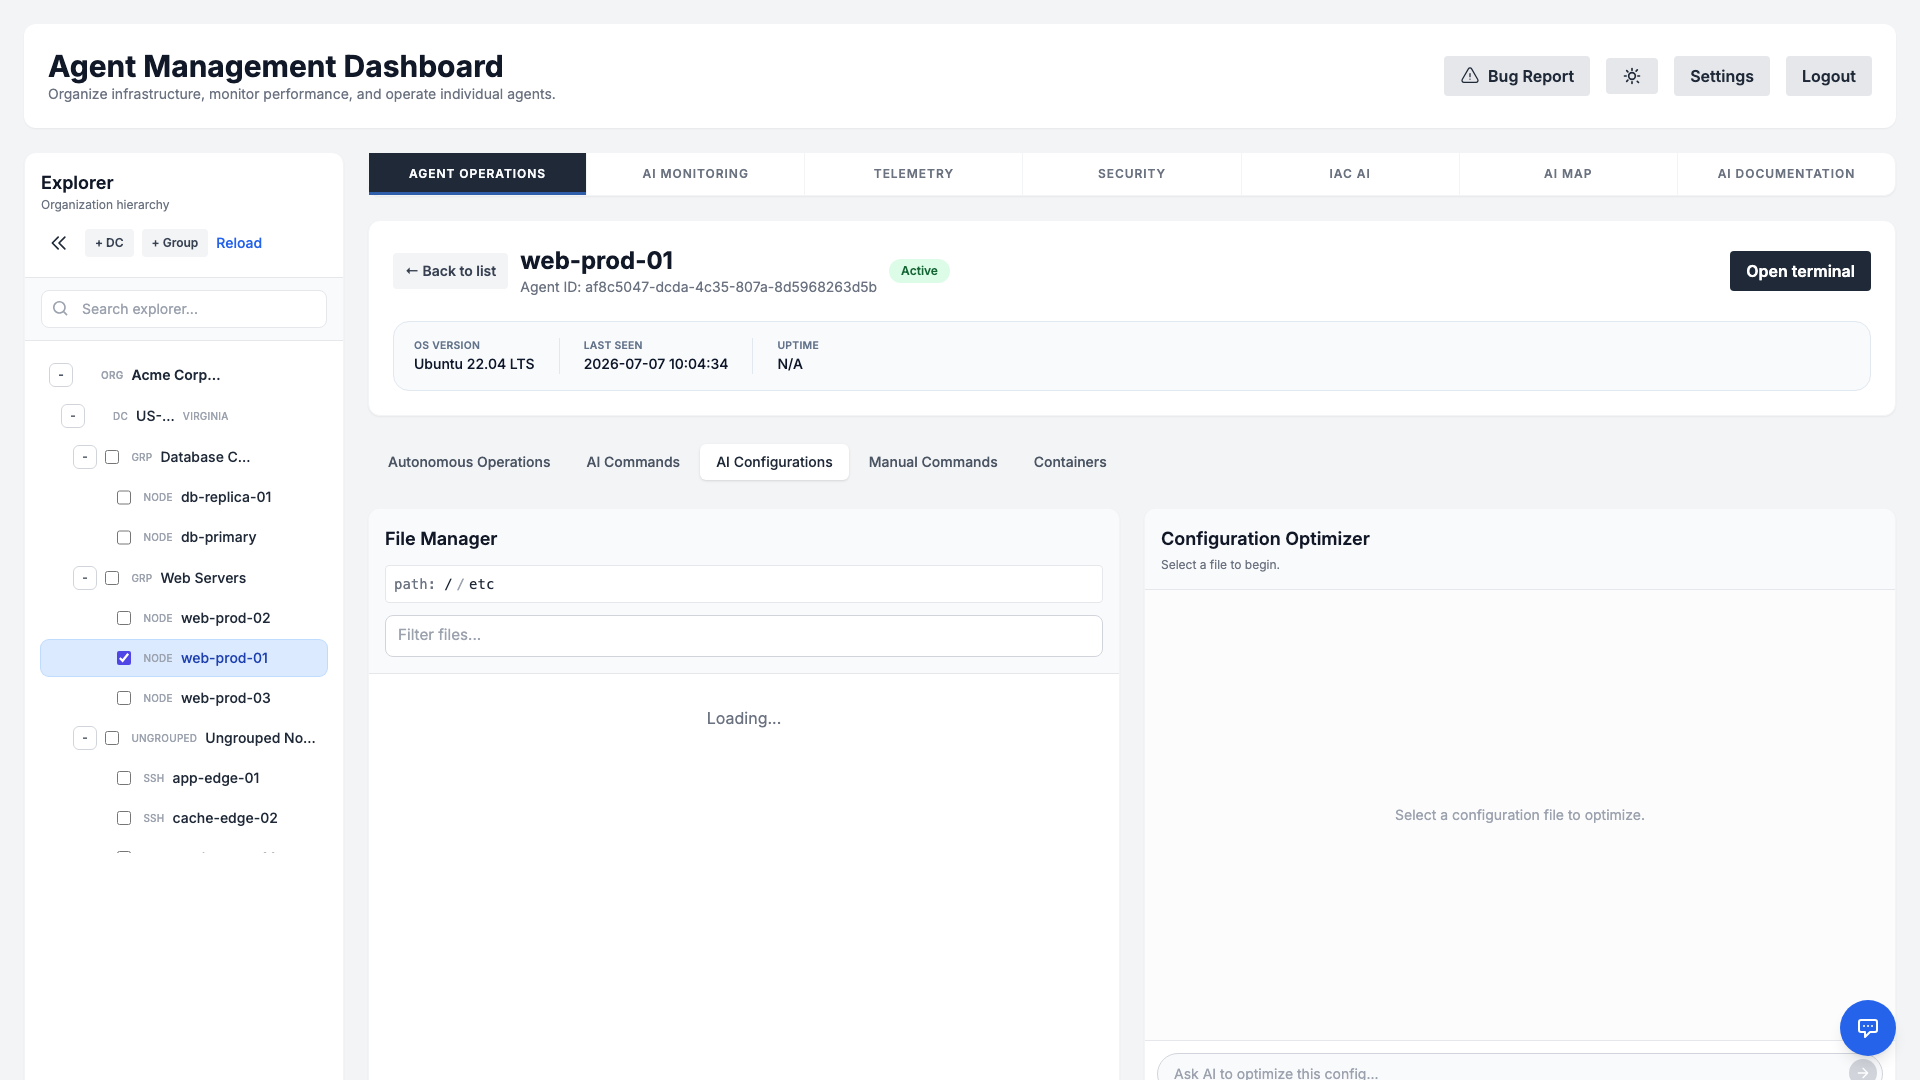
AI Configurations
The AI Configurations tab pairs a remote File Manager with an AI-powered Configuration Optimizer, so you can review and improve configuration files on any agent without leaving the dashboard. Browse the agent's filesystem, open a config file (for example nginx.conf, sshd_config, or my.cnf), and the AI reads its contents and helps you analyze, harden, or tune it.
How it works
- Browse & select: Use the breadcrumb path and filter box in the File Manager to navigate the agent's directories and pick the configuration file you want to work on.
- Ask the AI: Describe what you need in plain English — "review this for security best practices", "enable gzip compression", or "explain what this setting does". The optimizer responds in a chat thread with analysis and concrete suggestions.
- Review & apply: When the AI proposes a change, it surfaces a Review & Apply Changes action so you can inspect the exact diff before anything is written. No edit is applied to the file until you approve it.
- Safe & audited: Changes respect RBAC permissions and are captured in the audit log, so configuration edits remain accountable and reversible.
Manual Commands & Terminal
When you prefer direct control, the Manual Commands tab lets you run raw Bash or PowerShell commands against a selected agent without involving the AI. It is ideal for quick, ad-hoc checks and for operators who already know exactly what they want to run.
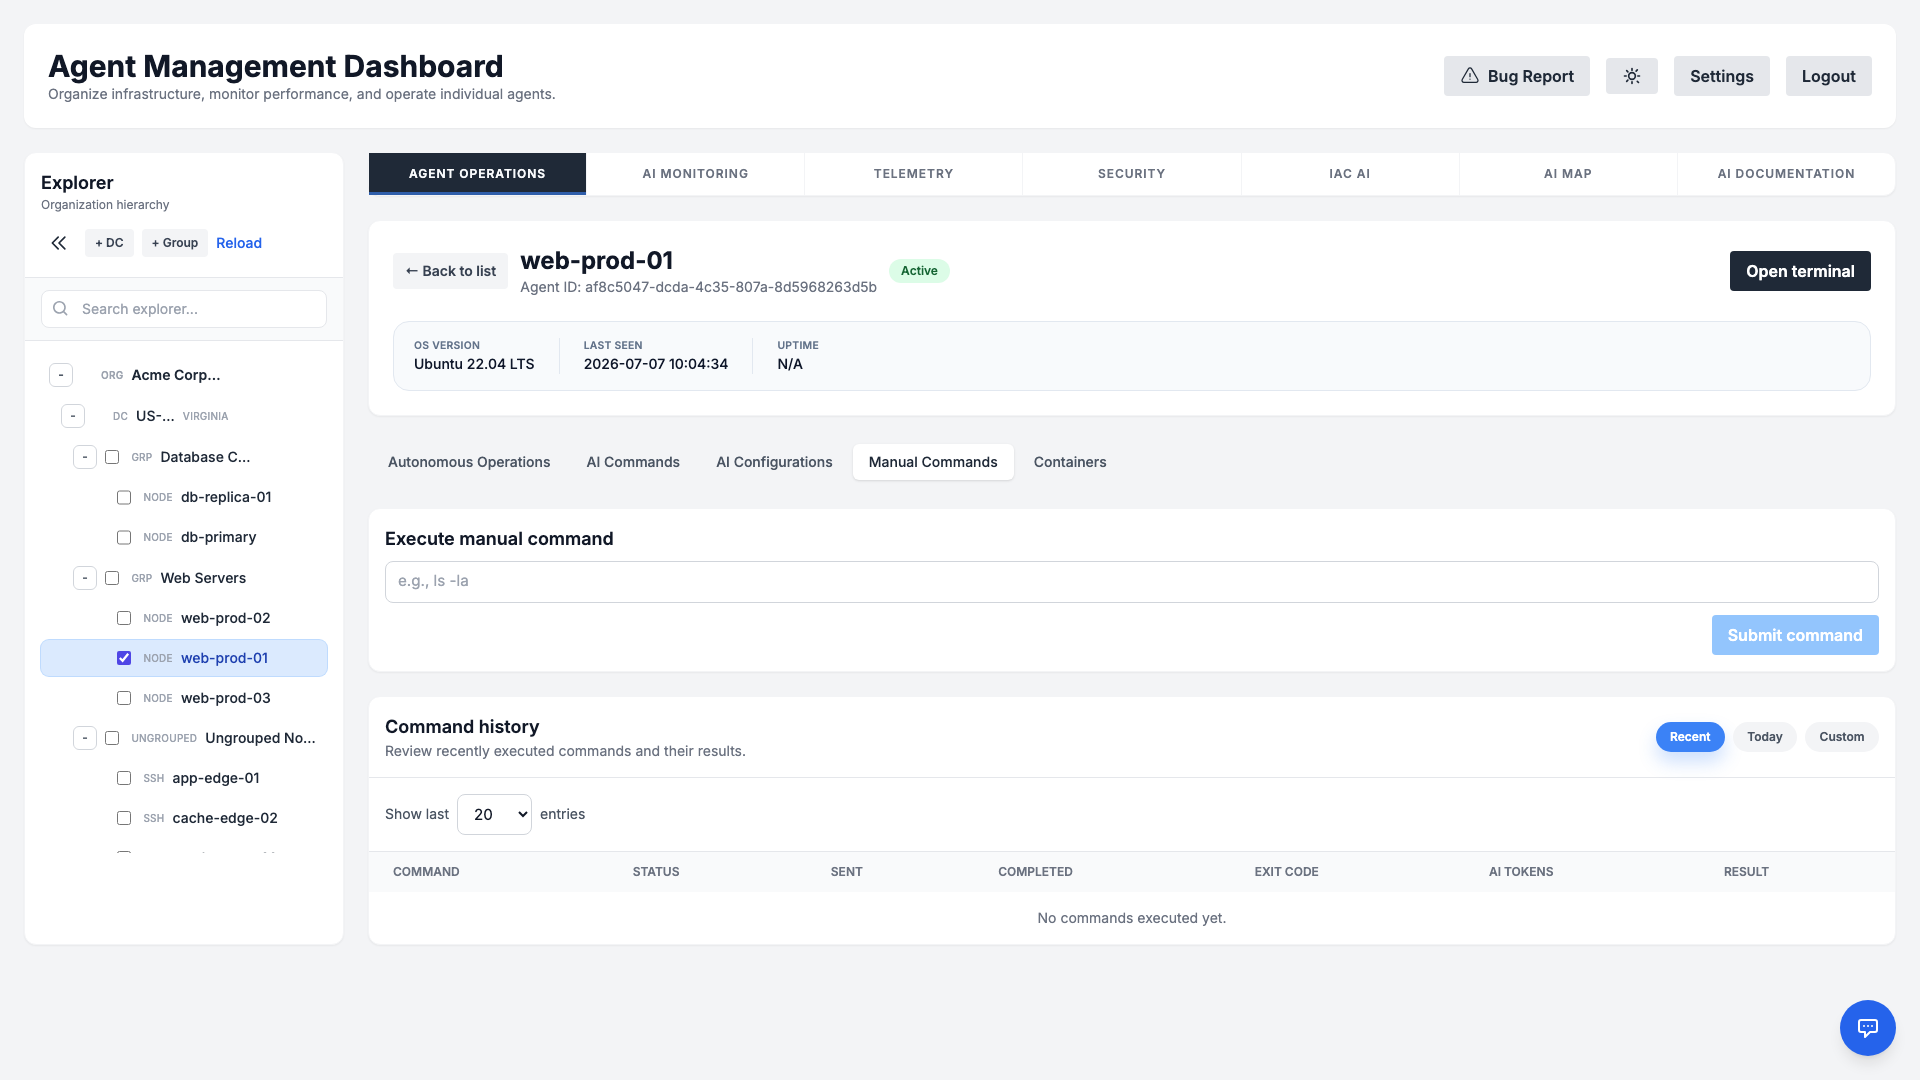
For a fully interactive session, use the Open Terminal feature to get a live, browser-based shell equivalent to SSH (Linux) or PowerShell Remoting (Windows). Every command issued here is captured in the audit log for accountability.
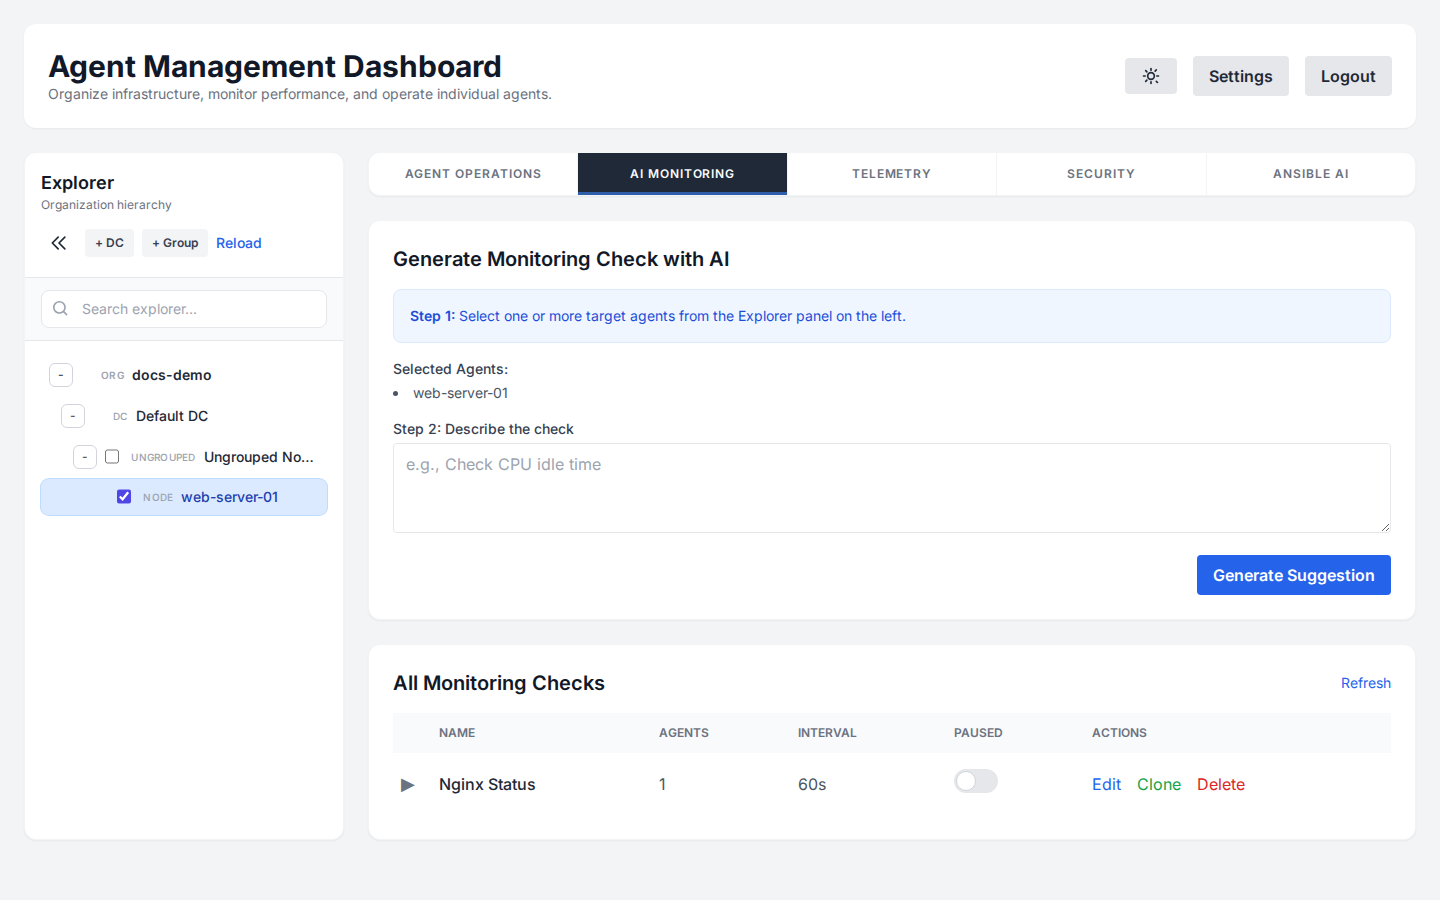
Monitoring Checks
Create custom monitoring scripts without writing code. Describe what you want to check, and the AI will generate the appropriate Bash, Python, or PowerShell script for you based on the agent's OS.
AI Analyze for Alarms
When a monitoring check triggers an alarm (Warning or Critical), you can use the AI Analyze feature. The AI will examine the check's output and system context to diagnose the root cause and suggest immediate remediation steps.
On-Call & Escalation
Make sure the right person is notified when something breaks. The On-Call module lets you organize engineers into Departments, build rotating On-Call Schedules, and define Escalation Rules that page the next responder if an alarm is not acknowledged in time.
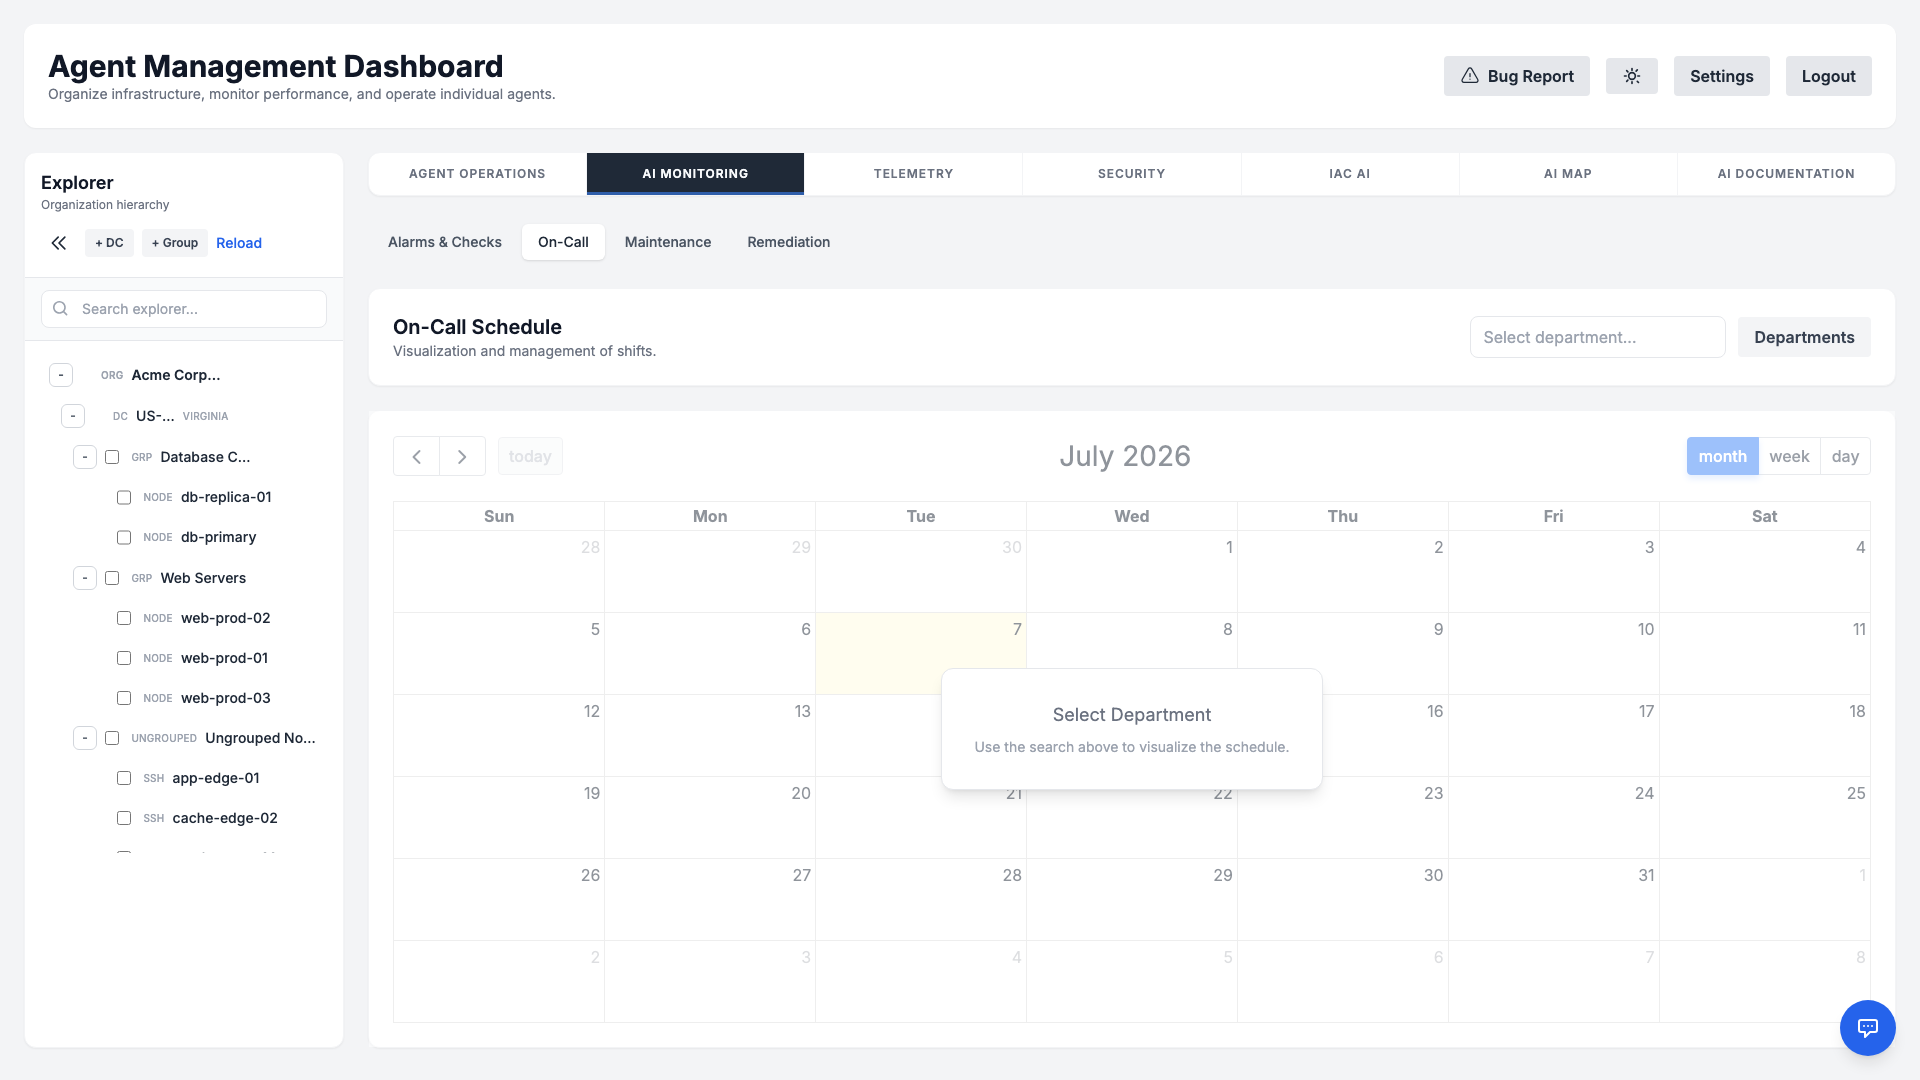
- Departments: Group responders by team (e.g., Platform, Database, Security).
- Schedules: Define who is on call for a given time window so alerts always reach an active responder.
- Escalation rules: Automatically escalate to a secondary contact or channel after a configurable delay if the first responder does not acknowledge.
Maintenance Windows
Avoid noisy, false alarms during planned work. A Maintenance Window temporarily suppresses alerting and automated remediation for a chosen scope — an entire datacenter or a specific agent — over a defined time range.
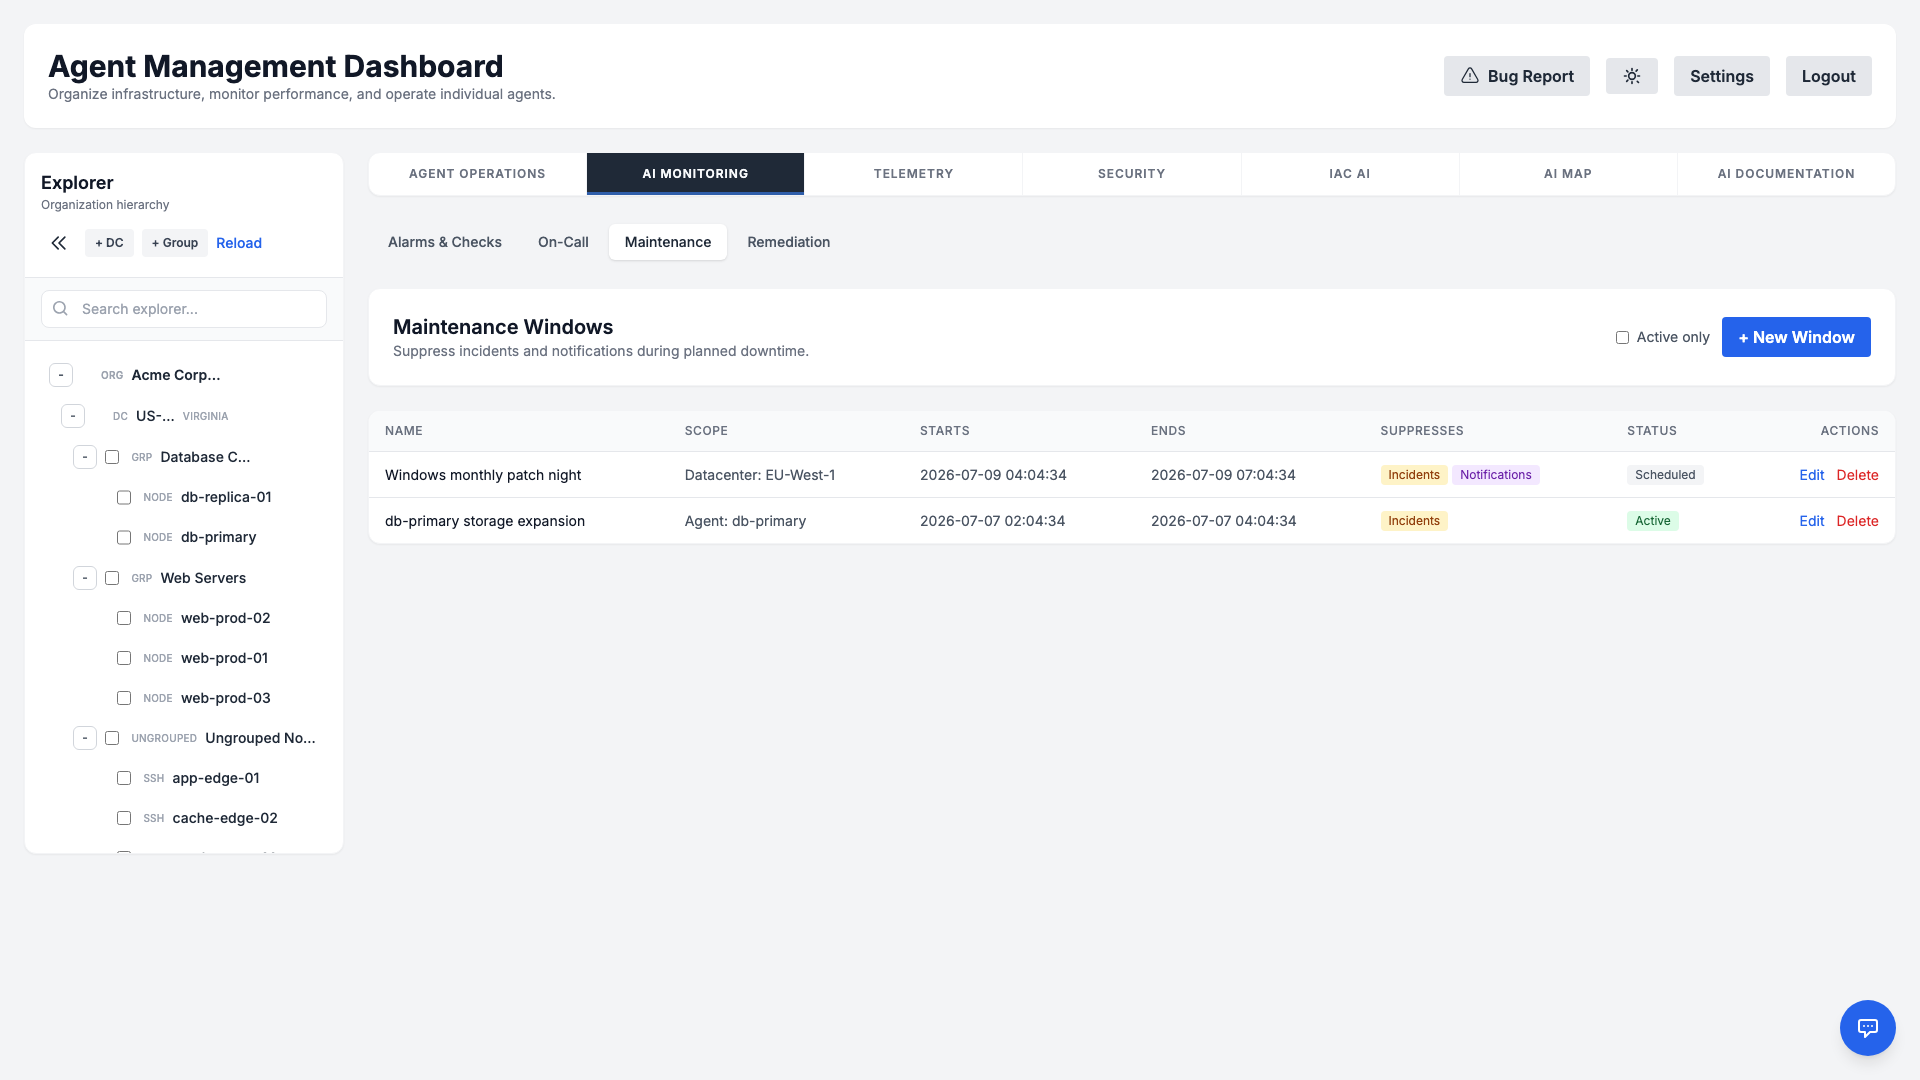
- Flexible scope: Apply a window to a single server or to all agents within a datacenter.
- Suppressed automation: Auto-remediation and escalation are paused for the duration, preventing unwanted changes during upgrades.
- Clear audit trail: Each window records who created it and why, keeping changes accountable.
Auto-Remediation
Turn repetitive fixes into self-healing automation. Remediation Rules connect a monitoring condition to a saved playbook or command, so the platform can resolve common incidents automatically — with or without an approval step.
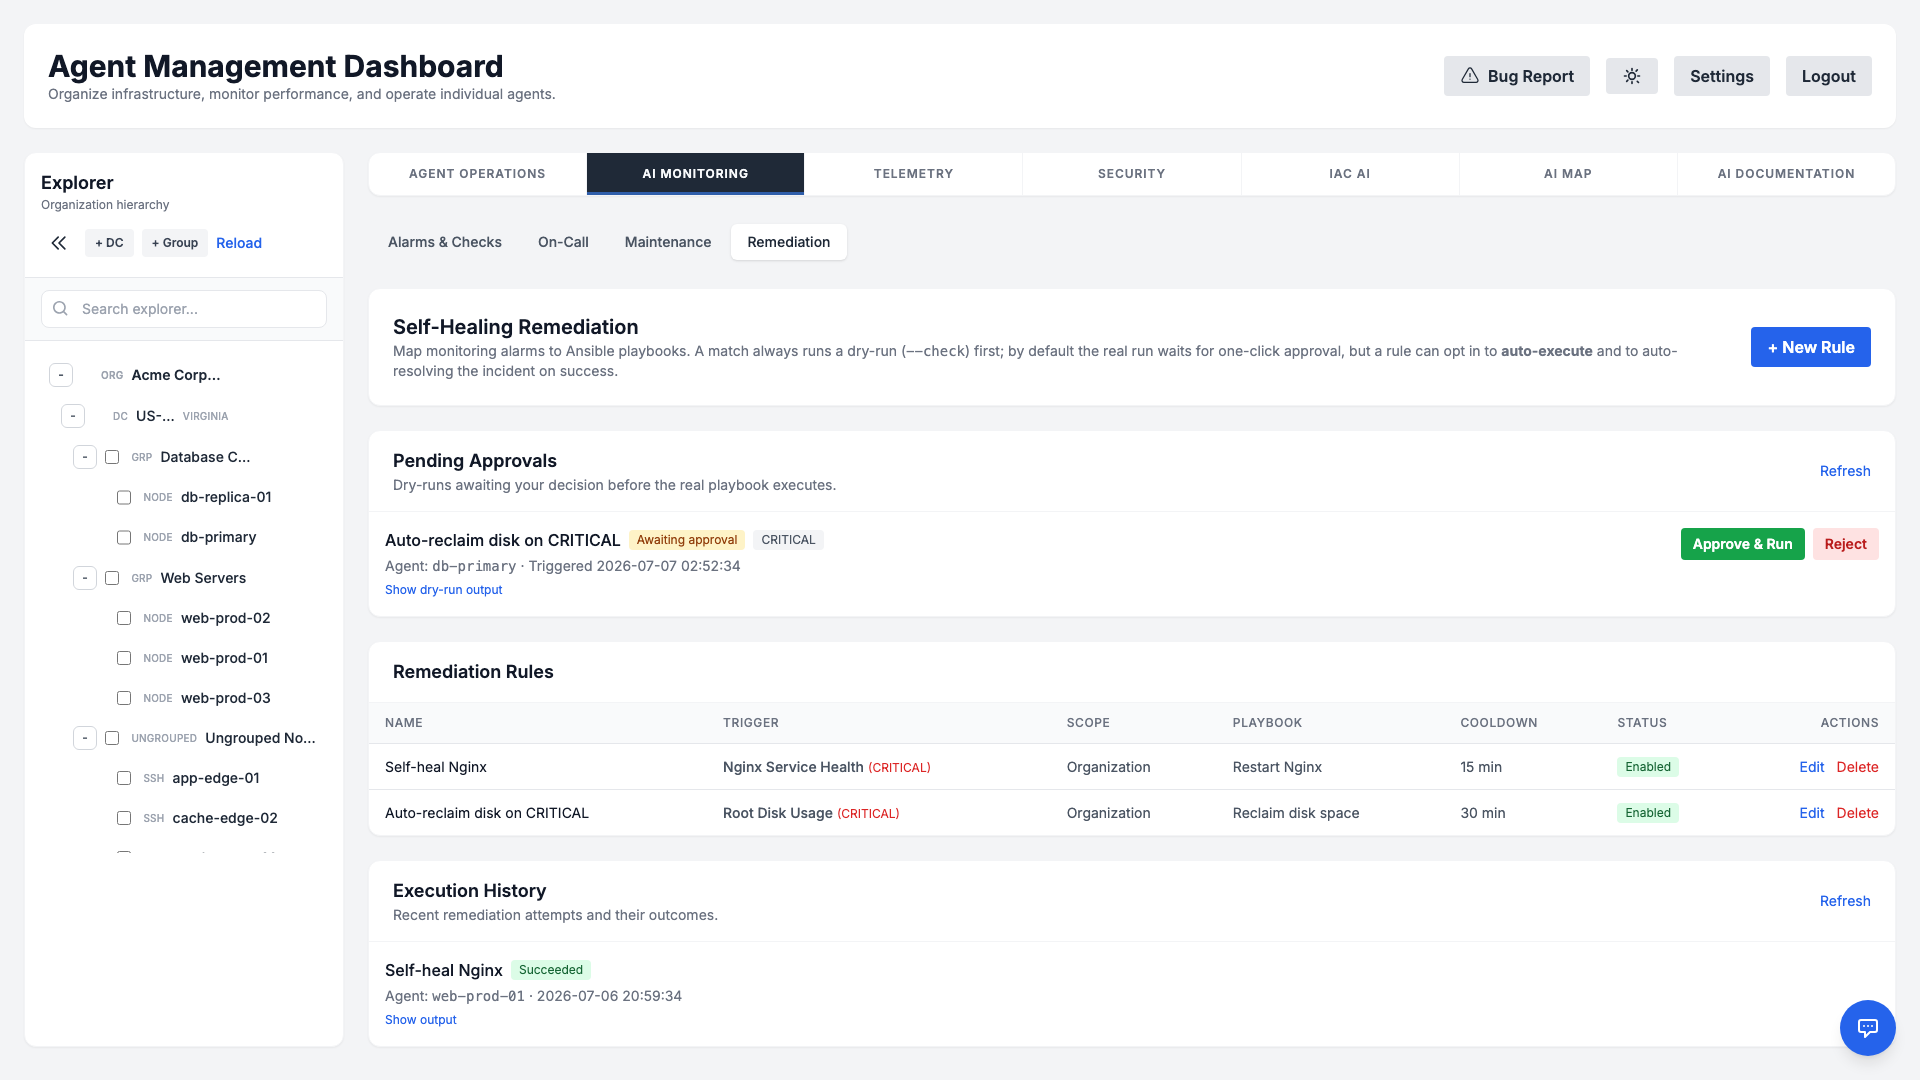
- Trigger: Bind a rule to a monitoring check or alarm severity.
- Action: Run a saved playbook or AI-generated remediation script on the affected agent.
- Guardrails: Optionally require manual approval, and respect any active maintenance window before acting.
- History: Every remediation execution is logged with its outcome for review.
Telemetry
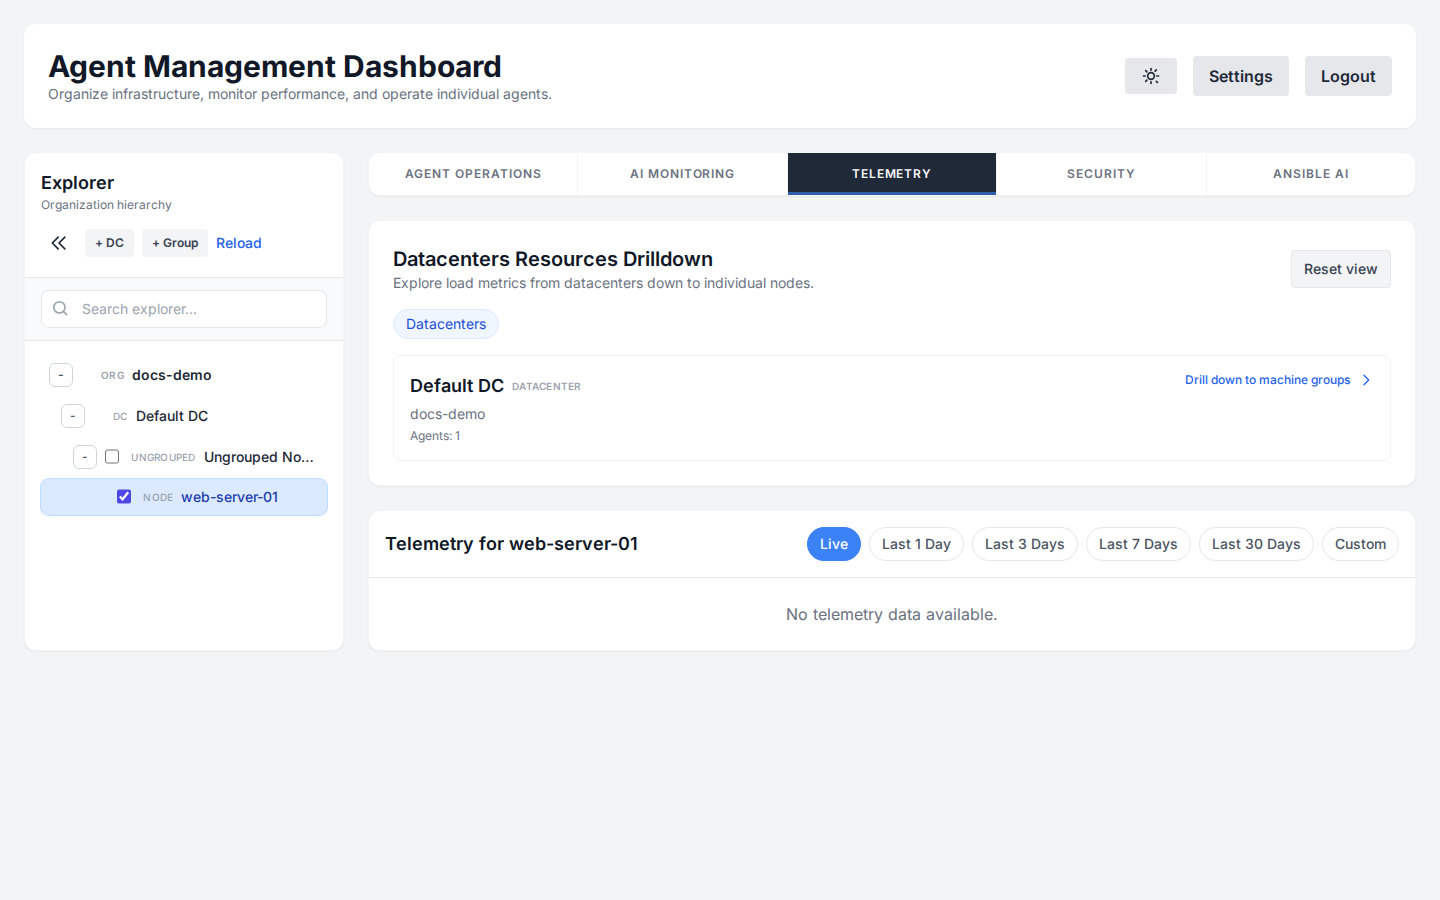
The Telemetry tab gives you a deep, time-series view of any single agent's health. Select a server in the Explorer and open Telemetry to see its historical metrics rendered as interactive charts.
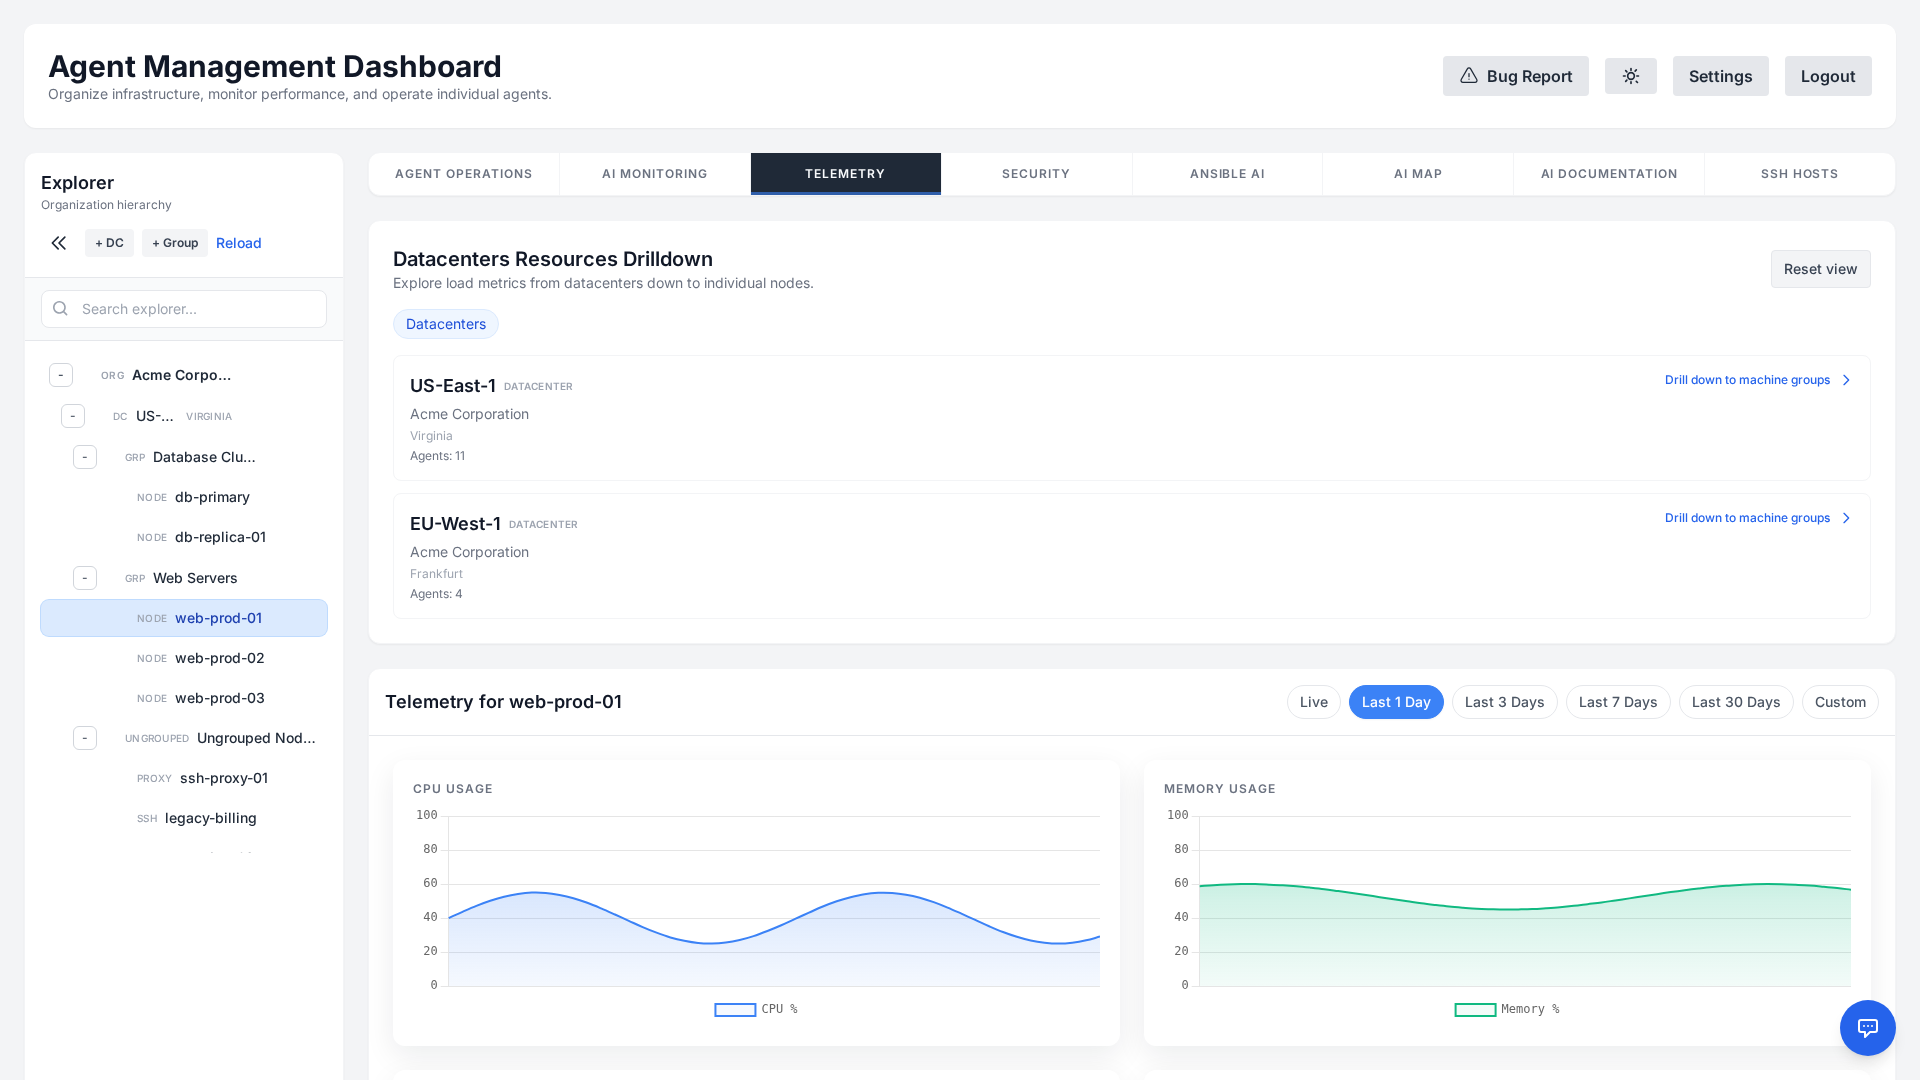
What you can see
- CPU & Memory usage over time, with selectable ranges (Live, 1d, 3d, 7d, 30d, or a custom window).
- Disk I/O — read/write throughput (KB/s), IOPS, utilization, and access time — plus disk usage percentage.
- Network throughput across interfaces.
- Top processes by CPU and by memory, so you can immediately spot what is driving load.
Switch to the Live range for a real-time stream from a connected agent, or pick a historical range to investigate a past incident. The same telemetry feeds the Predictive Analytics forecasts below.
Predictive Analytics
The system includes built-in Predictive Monitoring capabilities enabled by default. Using advanced algorithms, the agent analyzes historical telemetry data to forecast future resource usage and prevent outages.
Algorithms Used
- Linear Regression (Disk Usage): Analyzes disk fill rates over the last 30 days to predict exhaustion.
- CRITICAL: Predicted to fill within 7 days.
- WARNING: Predicted to fill within 14 days.
- Holt's Linear Trend (CPU & Memory): Uses exponential smoothing to detect saturation trends over the last 7 days.
- CRITICAL: Forecast > 95% saturation.
- WARNING: Forecast > 85% (CPU) or > 90% (Memory).
No additional configuration is required; these checks run automatically in the background on both Linux and Windows agents.
Forecasts surface alongside your other checks as system alarms — System: Predictive Disk Space, System: Predictive CPU Saturation, and System: Predictive Memory — in AI Monitoring → Alarms & Checks, and trigger your configured notification channels and on-call escalations when a WARNING or CRITICAL threshold is reached.
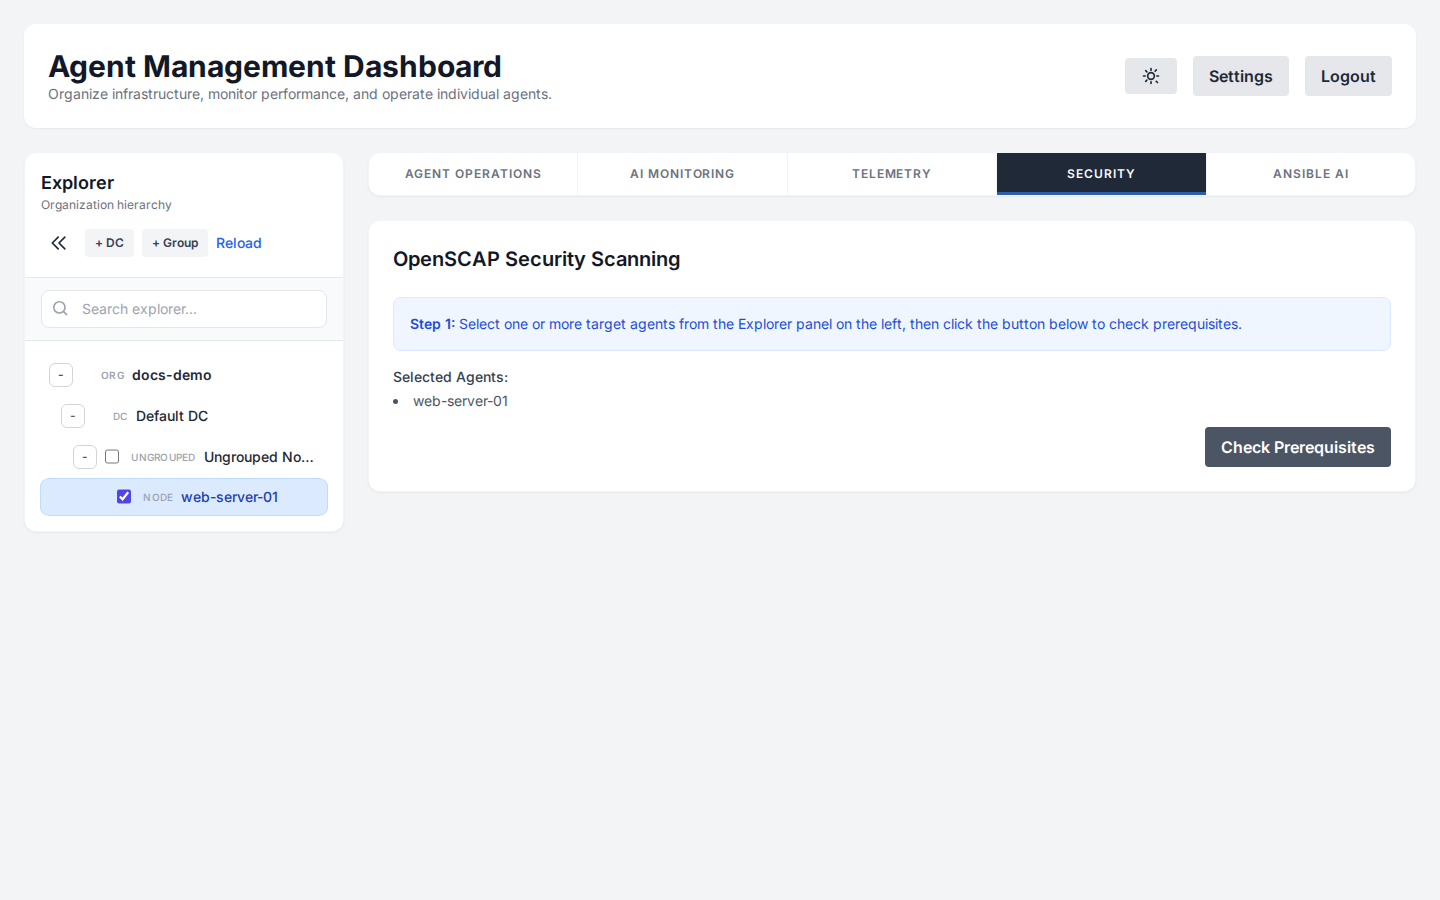
Security Scanning
Ensure compliance with OpenSCAP (Linux) and native security baselines (Windows). The agent can run automated scans against profiles like PCI-DSS or HIPAA and report vulnerabilities along with AI-generated remediation scripts.
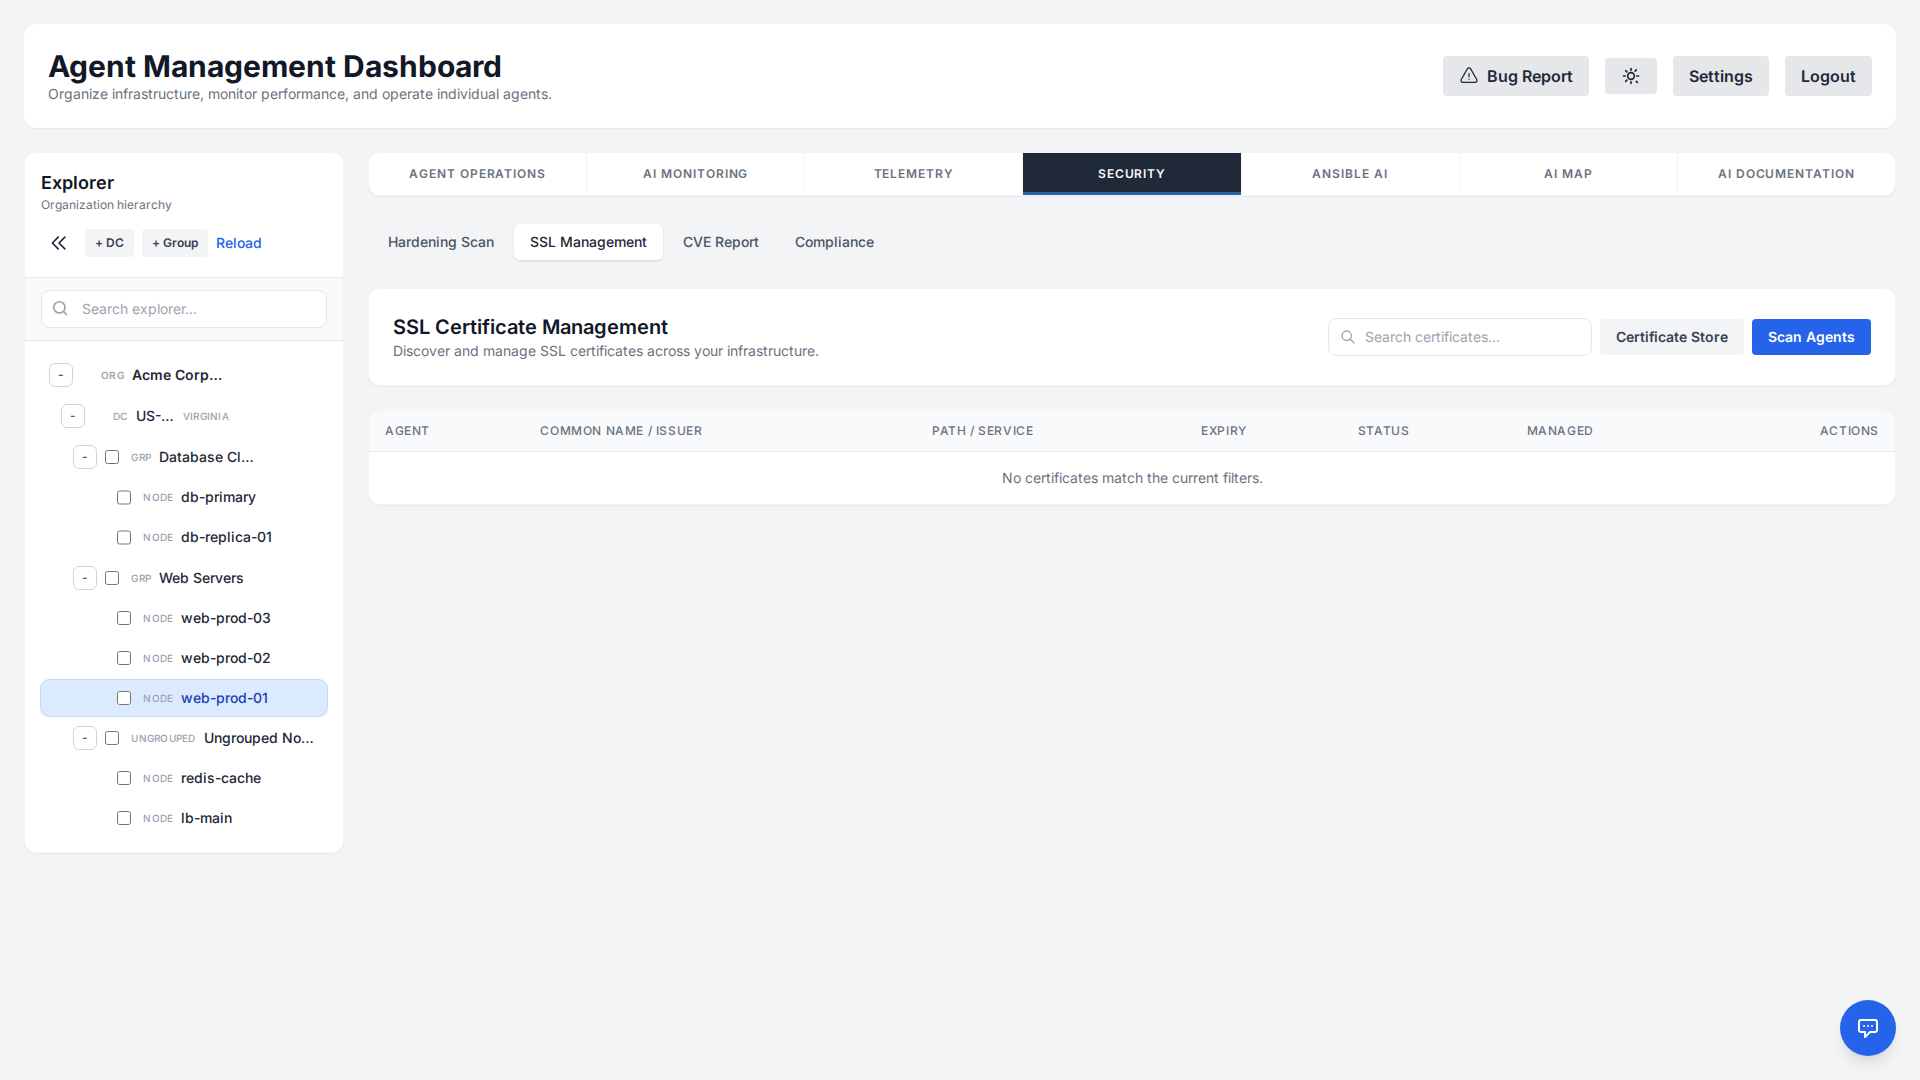
SSL Management
The agent automatically scans for and inventories SSL certificates on your servers, alerts you before they expire, and lets you replace them from a secure local certificate store — all from the dashboard.
Discovery & Inventory
A specialized discovery script scans common certificate locations (e.g., /etc/ssl/certs for Linux, IIS and the Windows Certificate Store) and parses .pem, .crt, .cer, and .pfx files.
It extracts key details:
- Common Name (CN)
- Issuer
- Expiration Date
- Associated Service (inferred from path or bindings)
Expiration Alerts
The platform continuously watches every discovered certificate and raises an alert as expiry approaches, so a forgotten renewal never causes an outage:
- WARNING: The certificate expires in less than 30 days.
- CRITICAL: The certificate expires in less than 7 days.
These alerts flow through the same incident and notification pipeline as your monitoring checks, so they reach your configured channels and on-call schedule.
Certificate Store & Replacement
You can replace or renew certificates directly from the dashboard. Upload a new certificate to the secure, organization-scoped Certificate Store (public key, private key, and optional chain/bundle), then deploy it to a target location on any agent:
- Store securely: Keep reusable certificates in the per-organization certificate store.
- Deploy on demand: Pick a target certificate path on an agent and the stored certificate to install.
- Review before applying: The platform generates an AI-assisted deployment plan that you review and confirm before it runs on the agent.
CVE Scanning
Stay ahead of known vulnerabilities across your fleet. The CVE Scanner inspects installed packages on Linux and applied updates on Windows, then maps them to published CVEs so you can prioritize patching by severity.
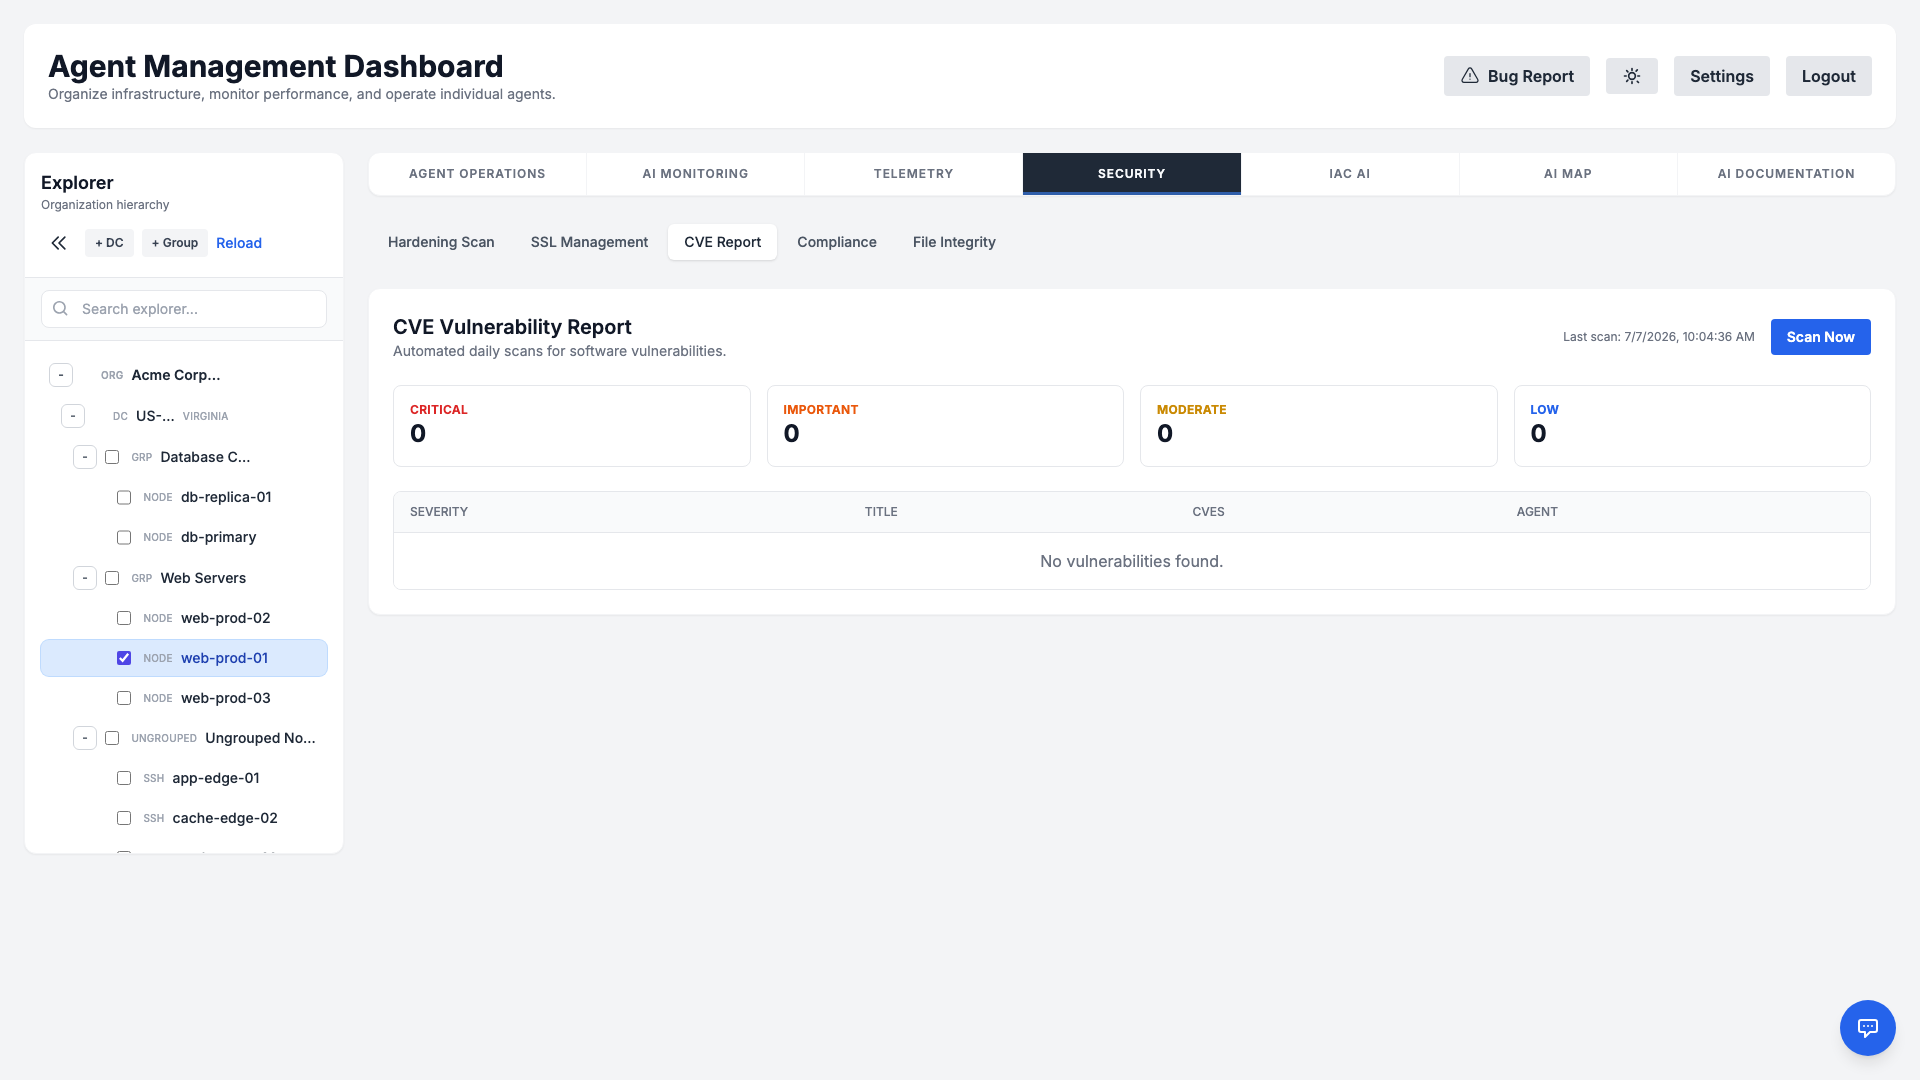
- Severity breakdown: Results are summarized by Critical, Important, Moderate, and Low so you can triage quickly.
- Cross-platform: Detects Linux package advisories (e.g., USN) and Windows update gaps (KB articles).
- Actionable detail: Each finding lists the affected component, related CVE identifiers, and a short description.
Compliance Reports
Demonstrate adherence to common frameworks with on-demand Compliance Reports. The platform consolidates scan results and configuration evidence into shareable, AI-generated assessments for the standard you select.
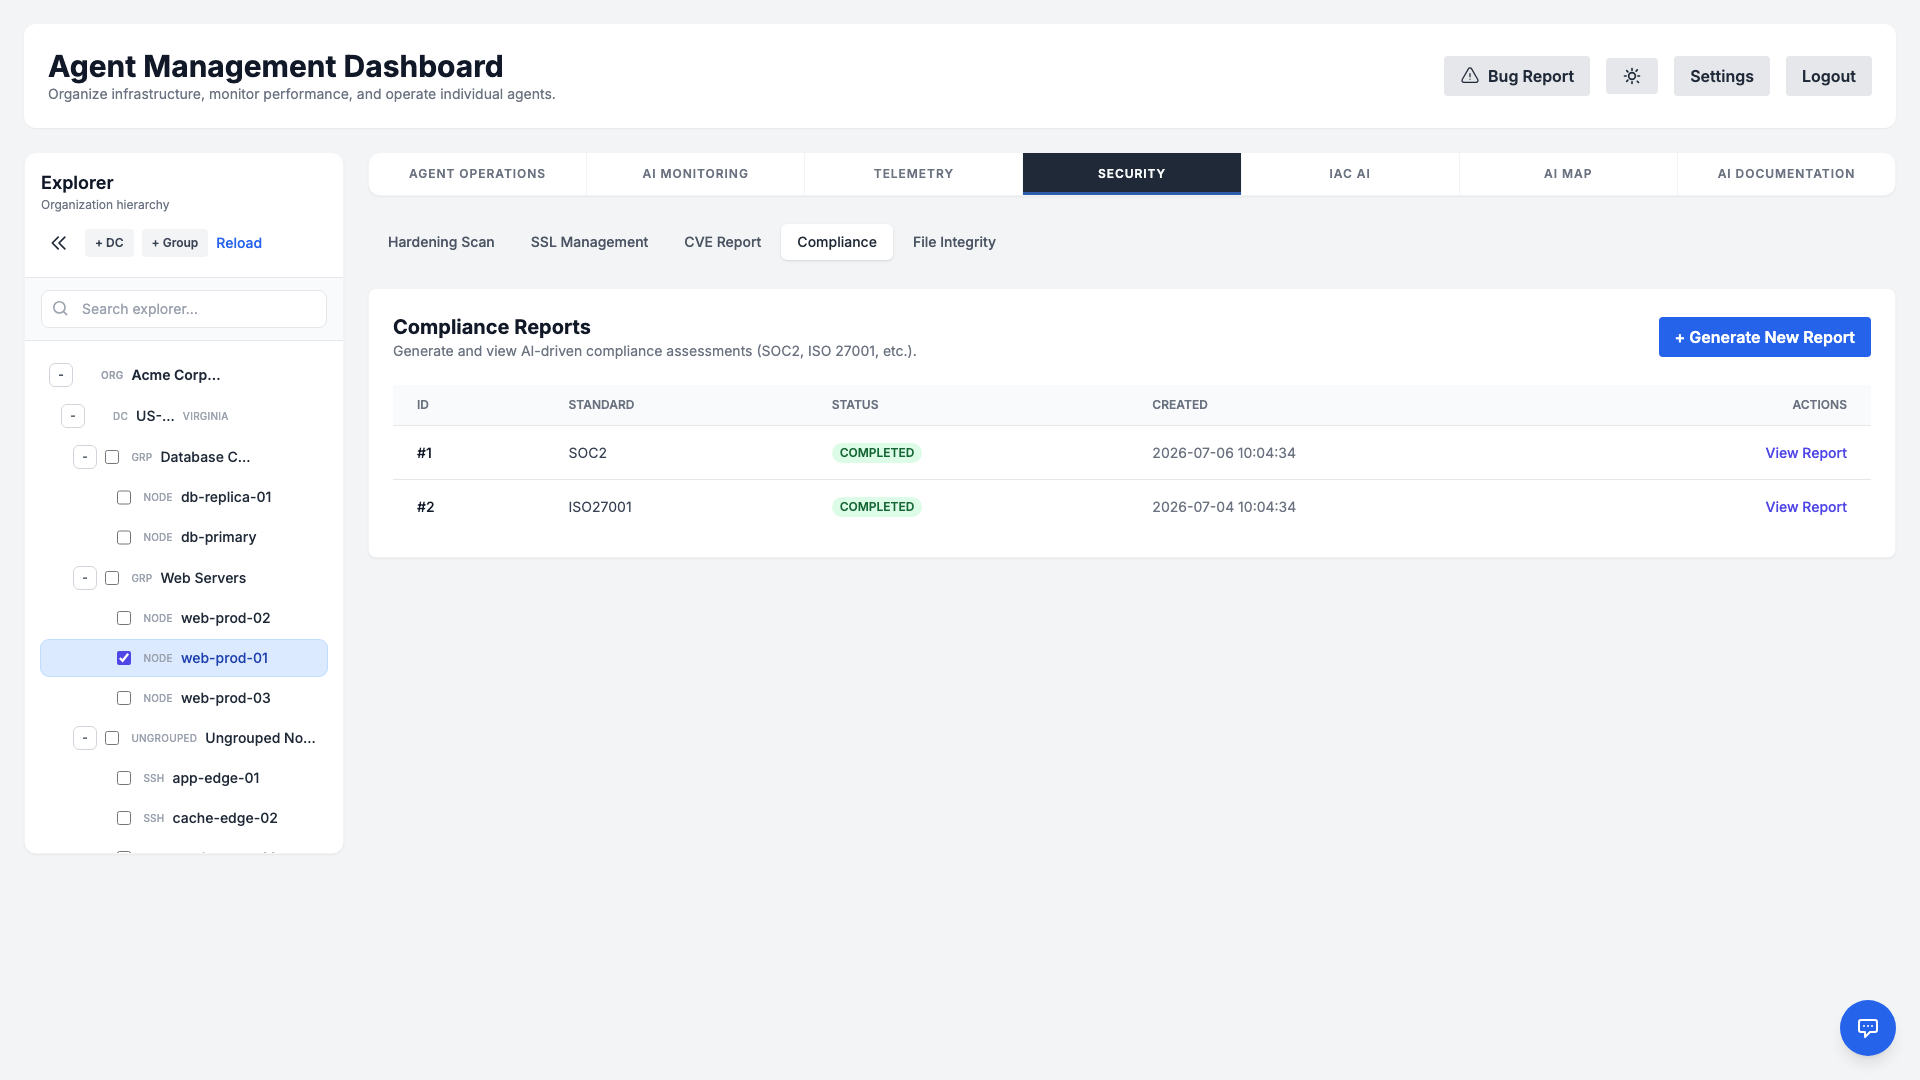
Choose from the following supported frameworks:
- SOC 2 Type II — Security and availability trust-service criteria.
- ISO 27001 — Information security management system controls.
- HIPAA — Safeguards for protected health information.
- DORA (EU) — Digital Operational Resilience Act ICT risk and resilience requirements.
- NIS 2 (EU) — Cybersecurity risk-management measures under the EU NIS 2 directive.
Reports render as formatted HTML you can review in the dashboard or export for auditors, giving you a point-in-time snapshot of your posture across the fleet.
File Integrity Monitoring (FIM)
Detect unauthorized or unexpected changes to critical files. File Integrity Monitoring establishes a cryptographic baseline for the paths you choose, then continuously watches for modifications, additions, and deletions.
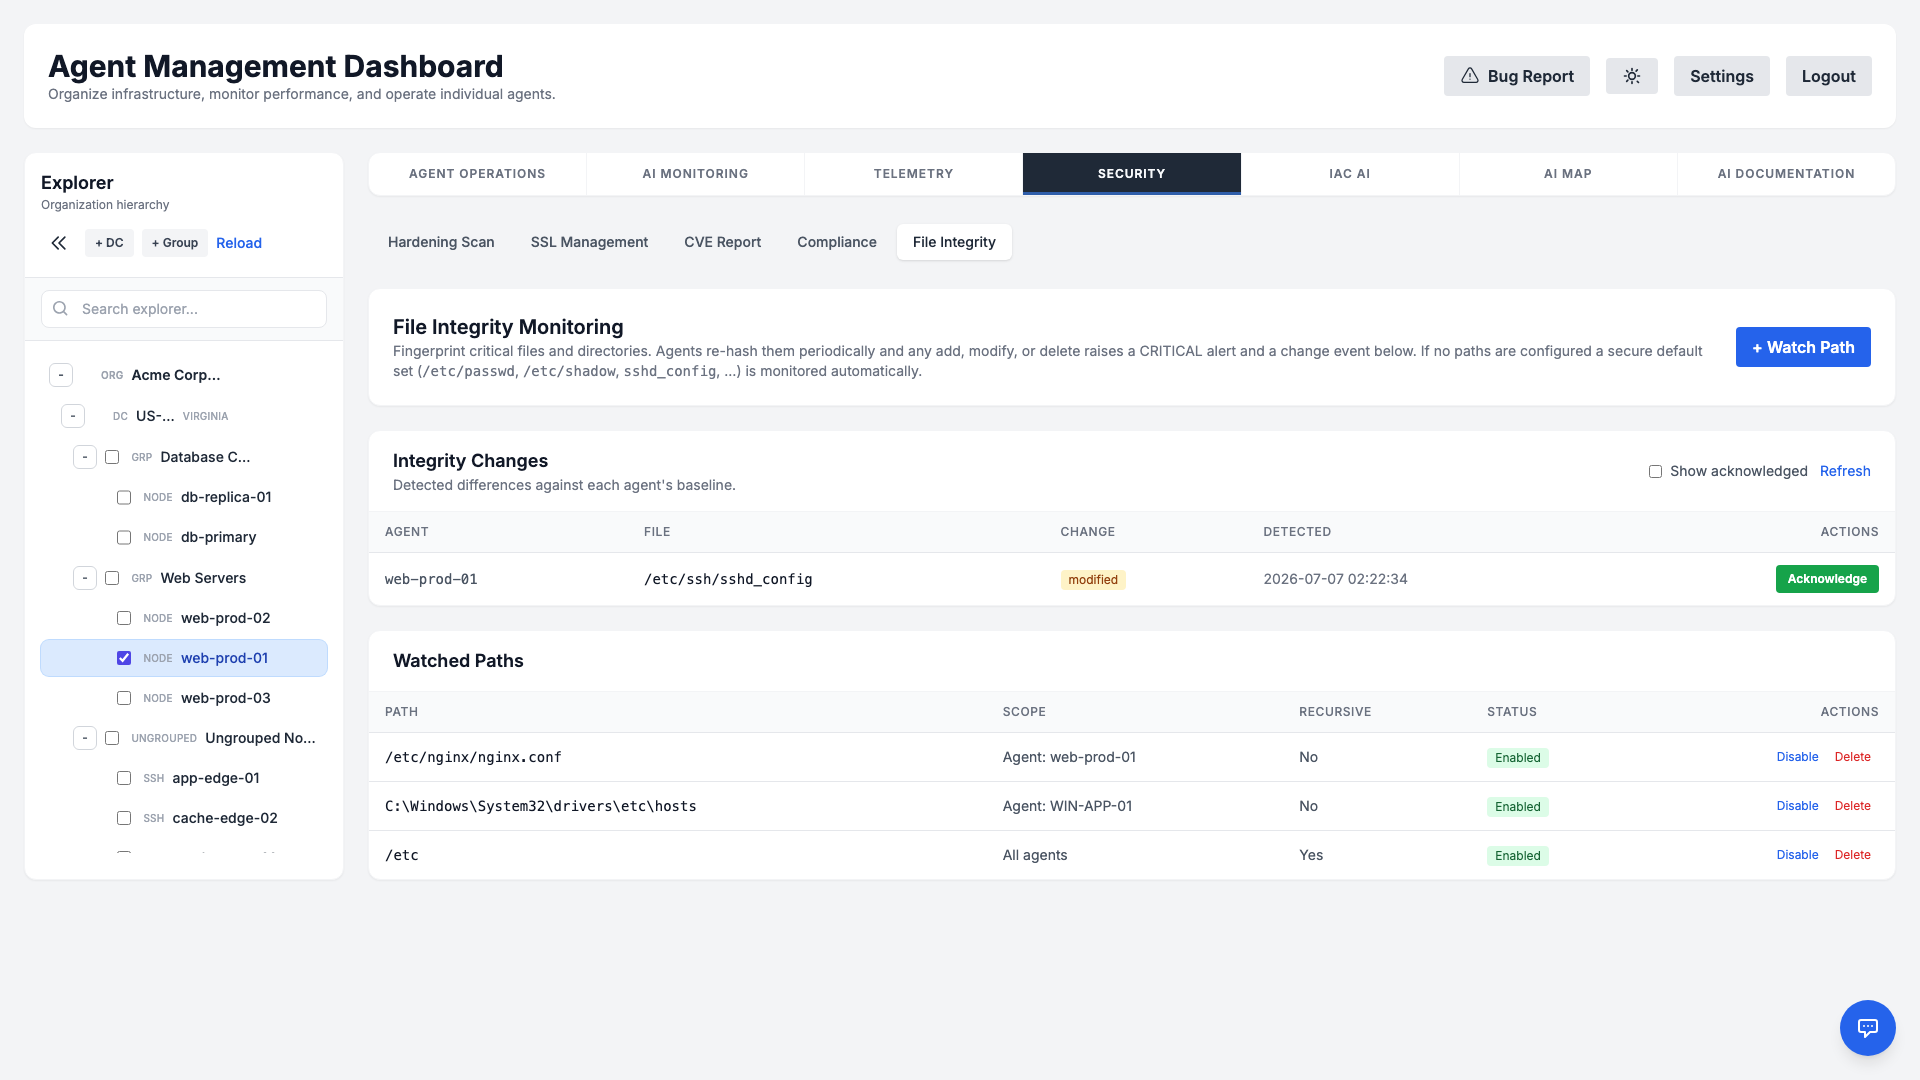
- Monitored paths: Track sensitive files and directories (e.g.,
/etcon Linux, key Windows configuration paths). - Baseline hashes: A trusted baseline of file hashes is captured so drift can be measured precisely.
- Change events: Any deviation generates a change event you can review, with details on what changed and when.
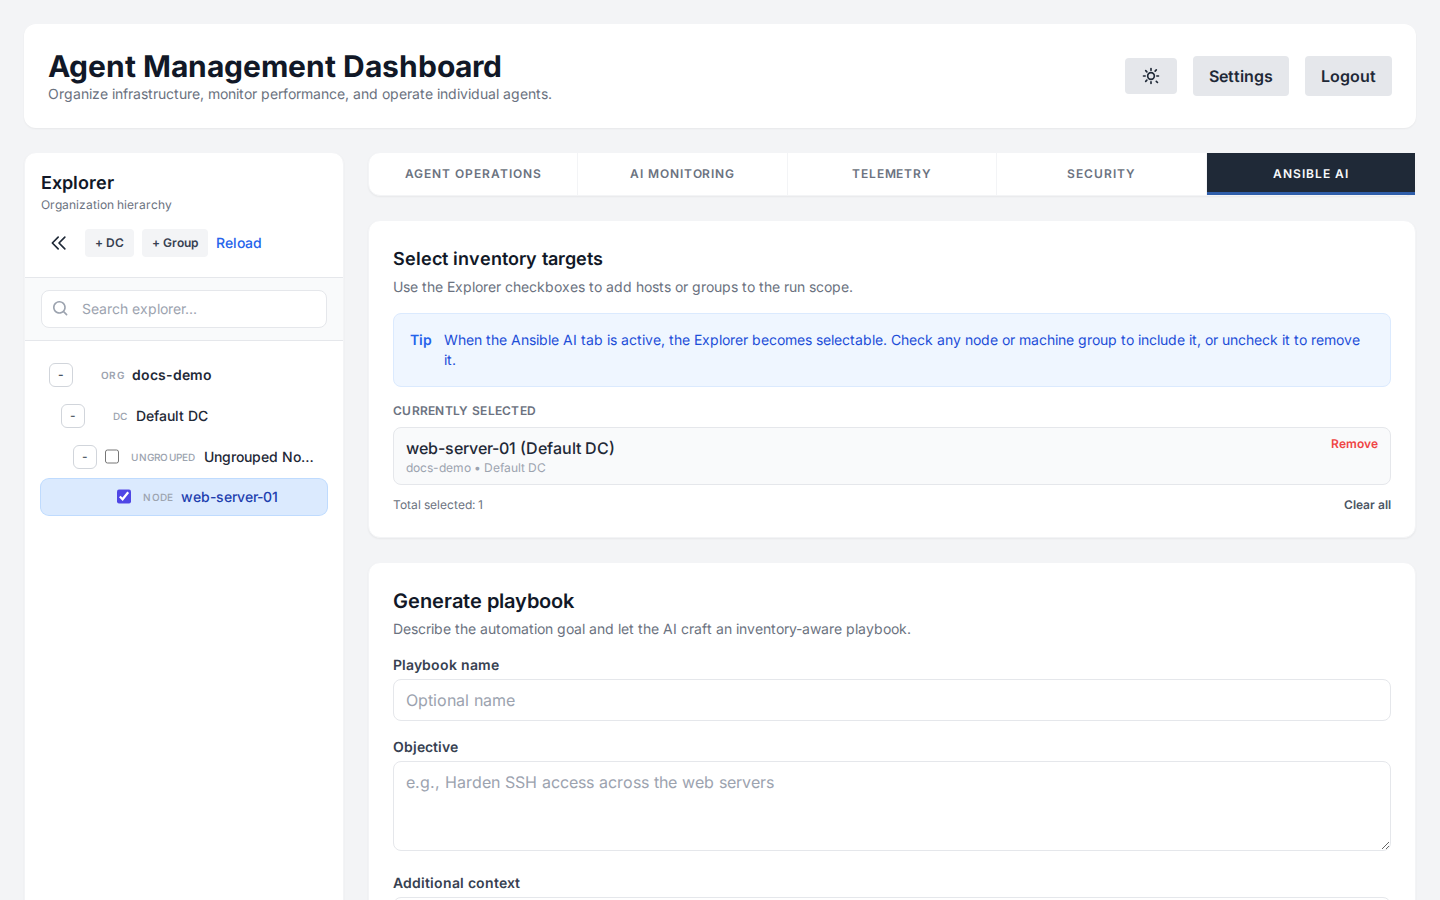
Ansible Automation
Generate Ansible playbooks for complex deployments. The AI ensures idempotency, follows best practices, and correctly targets winrm or ssh connections based on the operating system.
Terraform Provisioning
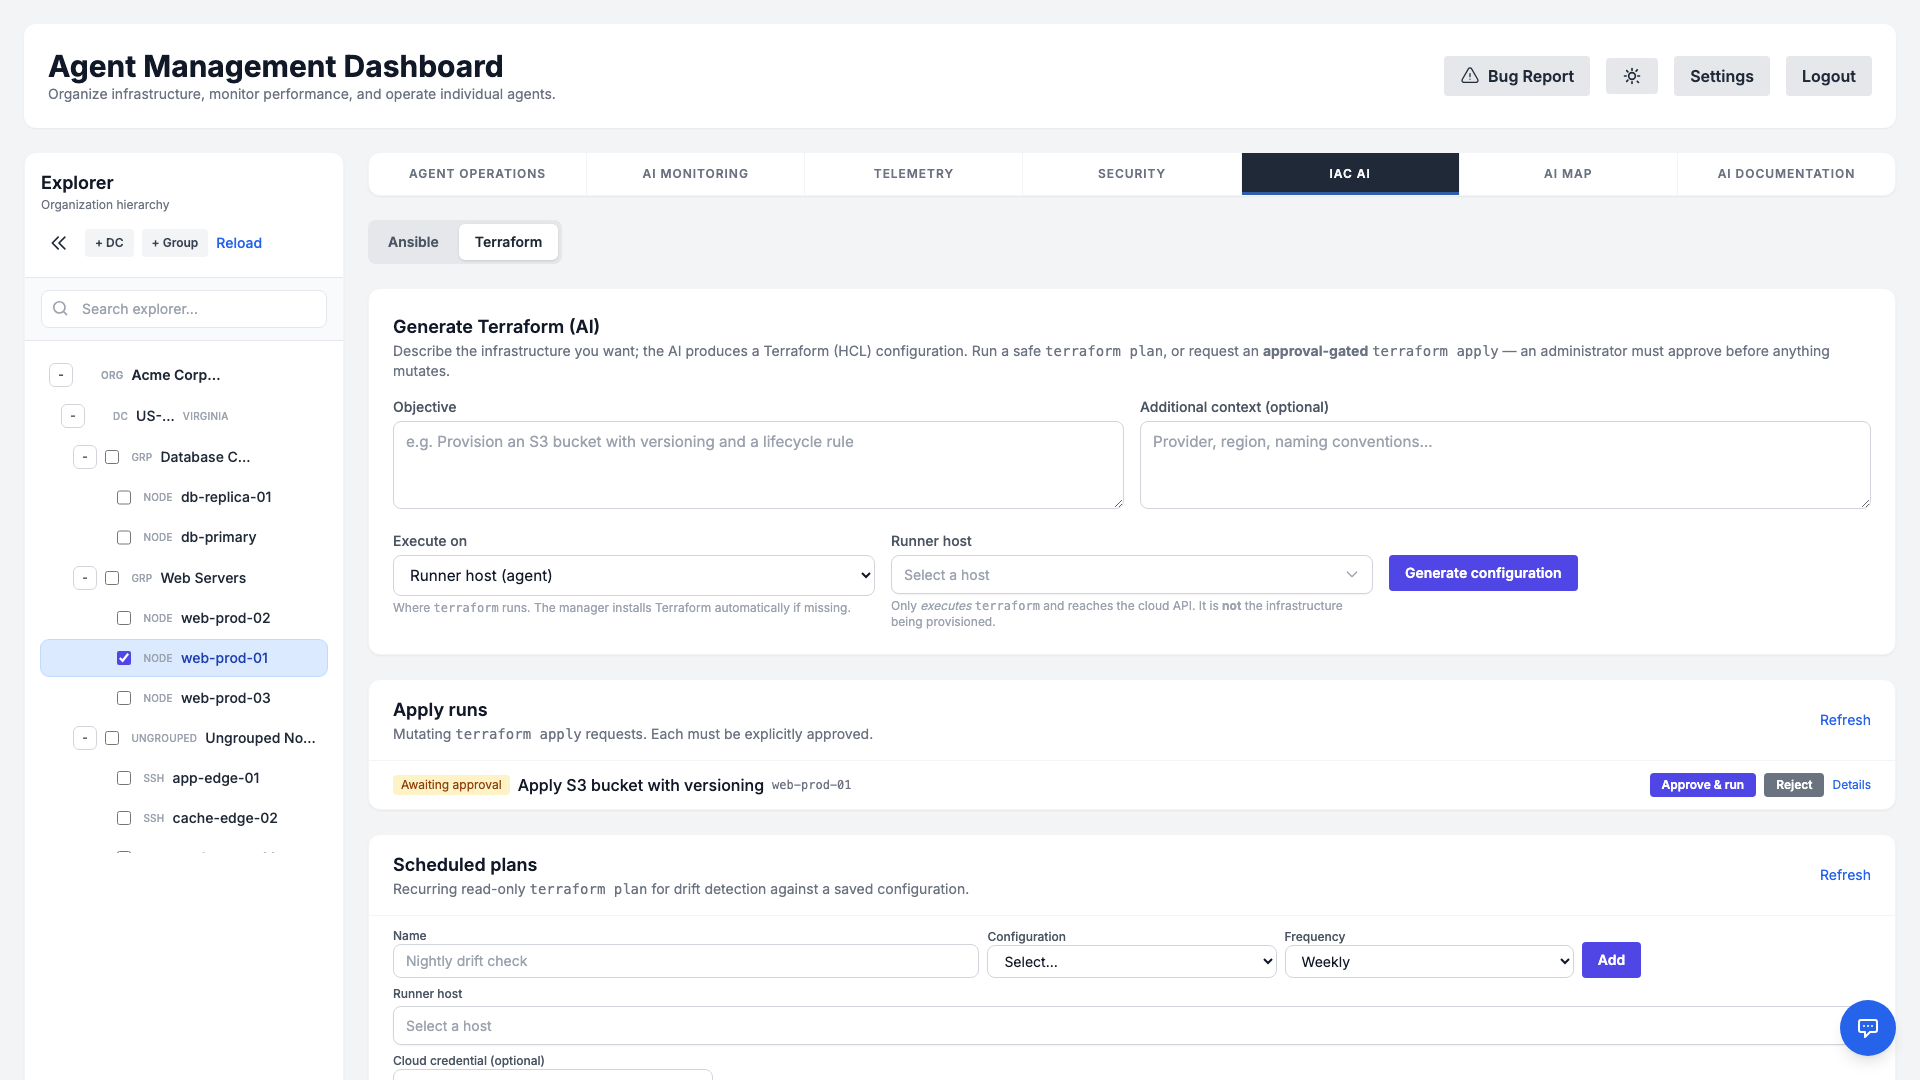
The Terraform tab of IaC AI turns a plain-English objective into production-ready Terraform (HCL) for the major clouds — AWS, GCP, Azure, and VMware. Describe what you want to provision and the AI writes the configuration, declaring proper variable blocks for anything it can't safely guess (AMI id, region, VPC/subnet, instance size, SSH key, …).
Iterative generate → validate → refine loop
Just like testing a monitoring check before saving it, you can iterate on a configuration before anything is applied:
- Required inputs form: Values the AI can't know are surfaced as a structured form you fill in, rather than guesswork or placeholder
terraform.tfvars. Apply inputs & regenerate bakes them into the configuration. - Validate (test): A fast, credential-free
terraform validatechecks config and schema correctness — no cloud API calls and no state changes. - Refine with AI: Describe a change in plain language (“add a lifecycle rule”, “change the region”) and the AI rewrites the current HCL in place.
Plan, and approval-gated apply
Run a safe, read-only terraform plan to preview changes at any time. A mutating terraform apply is approval-gated — it is submitted as a request that an administrator must explicitly approve before anything is created, changed, or destroyed. Recurring scheduled plans can run automatically for drift detection against a saved configuration.
Runner & cloud credentials
- Flexible runner: Choose Manager (this server) or a runner host to execute
terraform. The runner only runs Terraform and reaches the cloud API — it is never the infrastructure being provisioned. Ifterraformisn't installed, the runner downloads a pinned, checksum-verified release on demand. - Encrypted credential vault: Per-organization cloud credential sets (AWS/GCP/Azure/VMware) are stored encrypted, injected into a run only as ephemeral environment variables, and never written to command history, logs, or generated HCL. Secret values are write-only — the UI shows only variable names.
- Configuration library: Save, organize (in folders), and reuse generated configurations per organization.
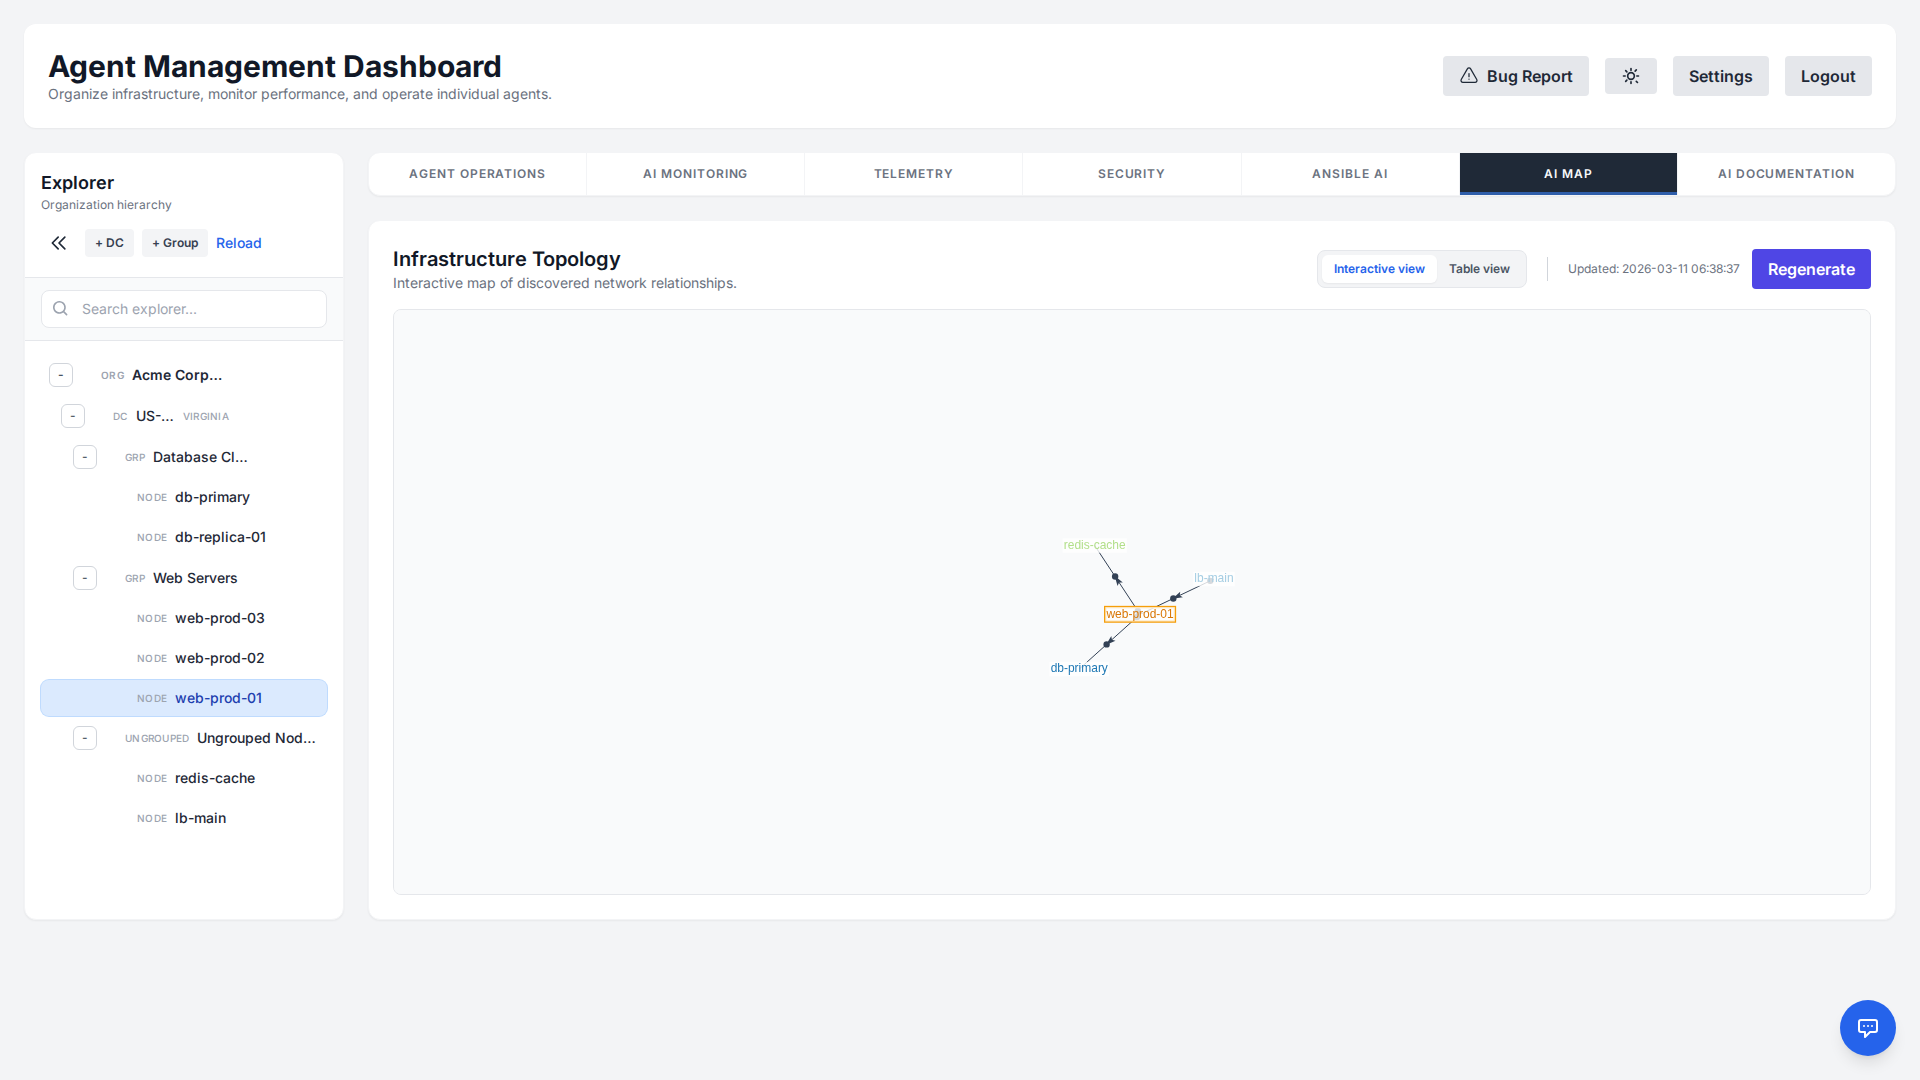
AI Map
Visualize your entire infrastructure topology in real-time. The AI Map provides an interactive graph view of all connected nodes, their relationships, and current status, allowing for quick identification of network bottlenecks and structural dependencies.
AI Documentation
Keep your infrastructure documentation in sync with reality. The AI Documentation feature automatically discovers installed packages, network configurations, running services, and more.
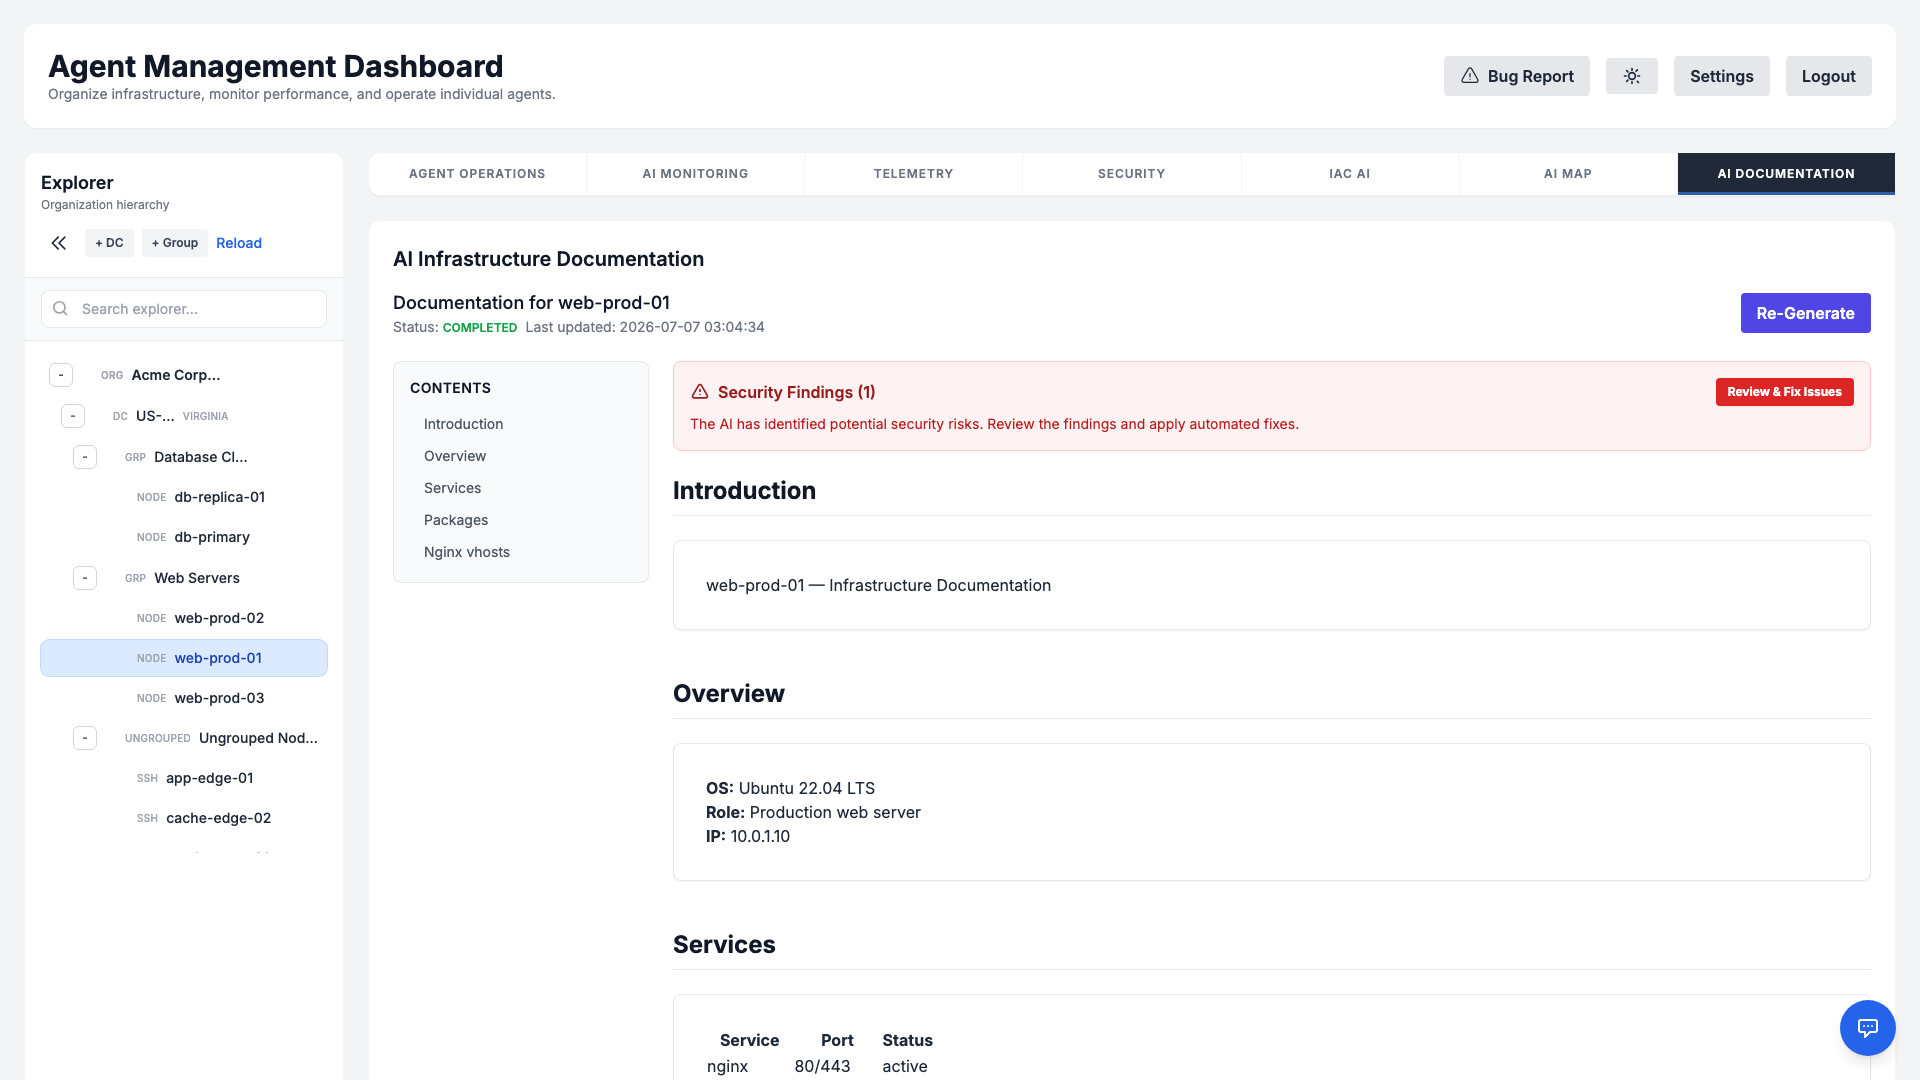
It then synthesizes this raw data into a structured, easy-to-read Markdown document, covering everything from OS details to IIS/Nginx vhost configurations. You can view, export, or regenerate this documentation directly from the dashboard to ensure you always have an up-to-date reference.
Notifications
Route alerts to wherever your team already works. From Settings → Notifications you can enable and configure multiple delivery channels, each toggled independently.
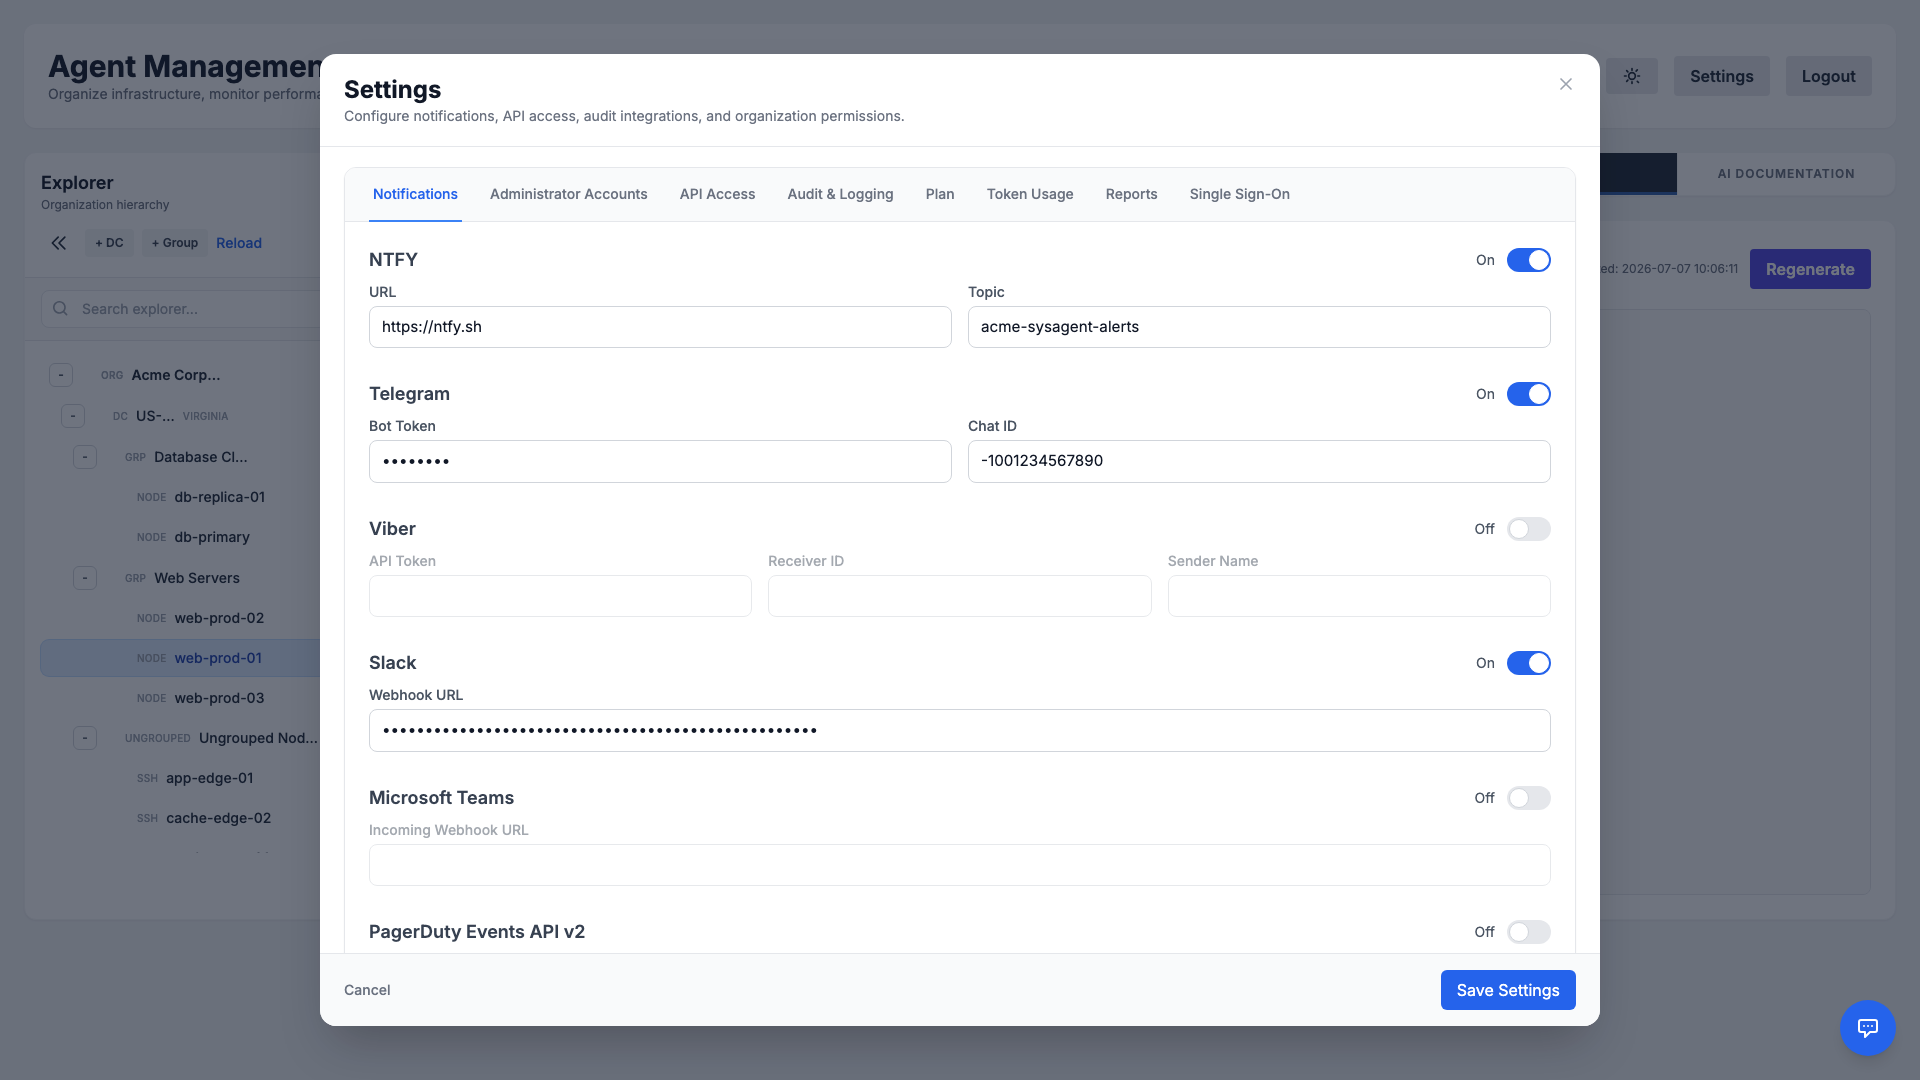
- ntfy: Lightweight push notifications via a topic URL (defaults to
https://ntfy.sh). - Telegram: Deliver alerts to a chat using a bot token and chat ID.
- Viber: Send alerts via an API token, receiver ID, and sender name.
- Slack: Post to a channel through an incoming webhook URL.
- Microsoft Teams: Post to a channel through an incoming webhook URL.
- PagerDuty: Trigger incidents through the Events API v2 using an integration key.
- Generic Webhook: POST a structured JSON payload to any HTTP endpoint, with optional custom headers, for custom integrations and chatops.
Each channel can be enabled and configured independently, and they integrate with on-call schedules and escalation rules so the right people are reached through the right channel.
RBAC & Permissions
Fine-grained Role-Based Access Control lets master administrators define exactly what each role can do. The Organization Permissions tab exposes a permission matrix covering every major function of the platform.
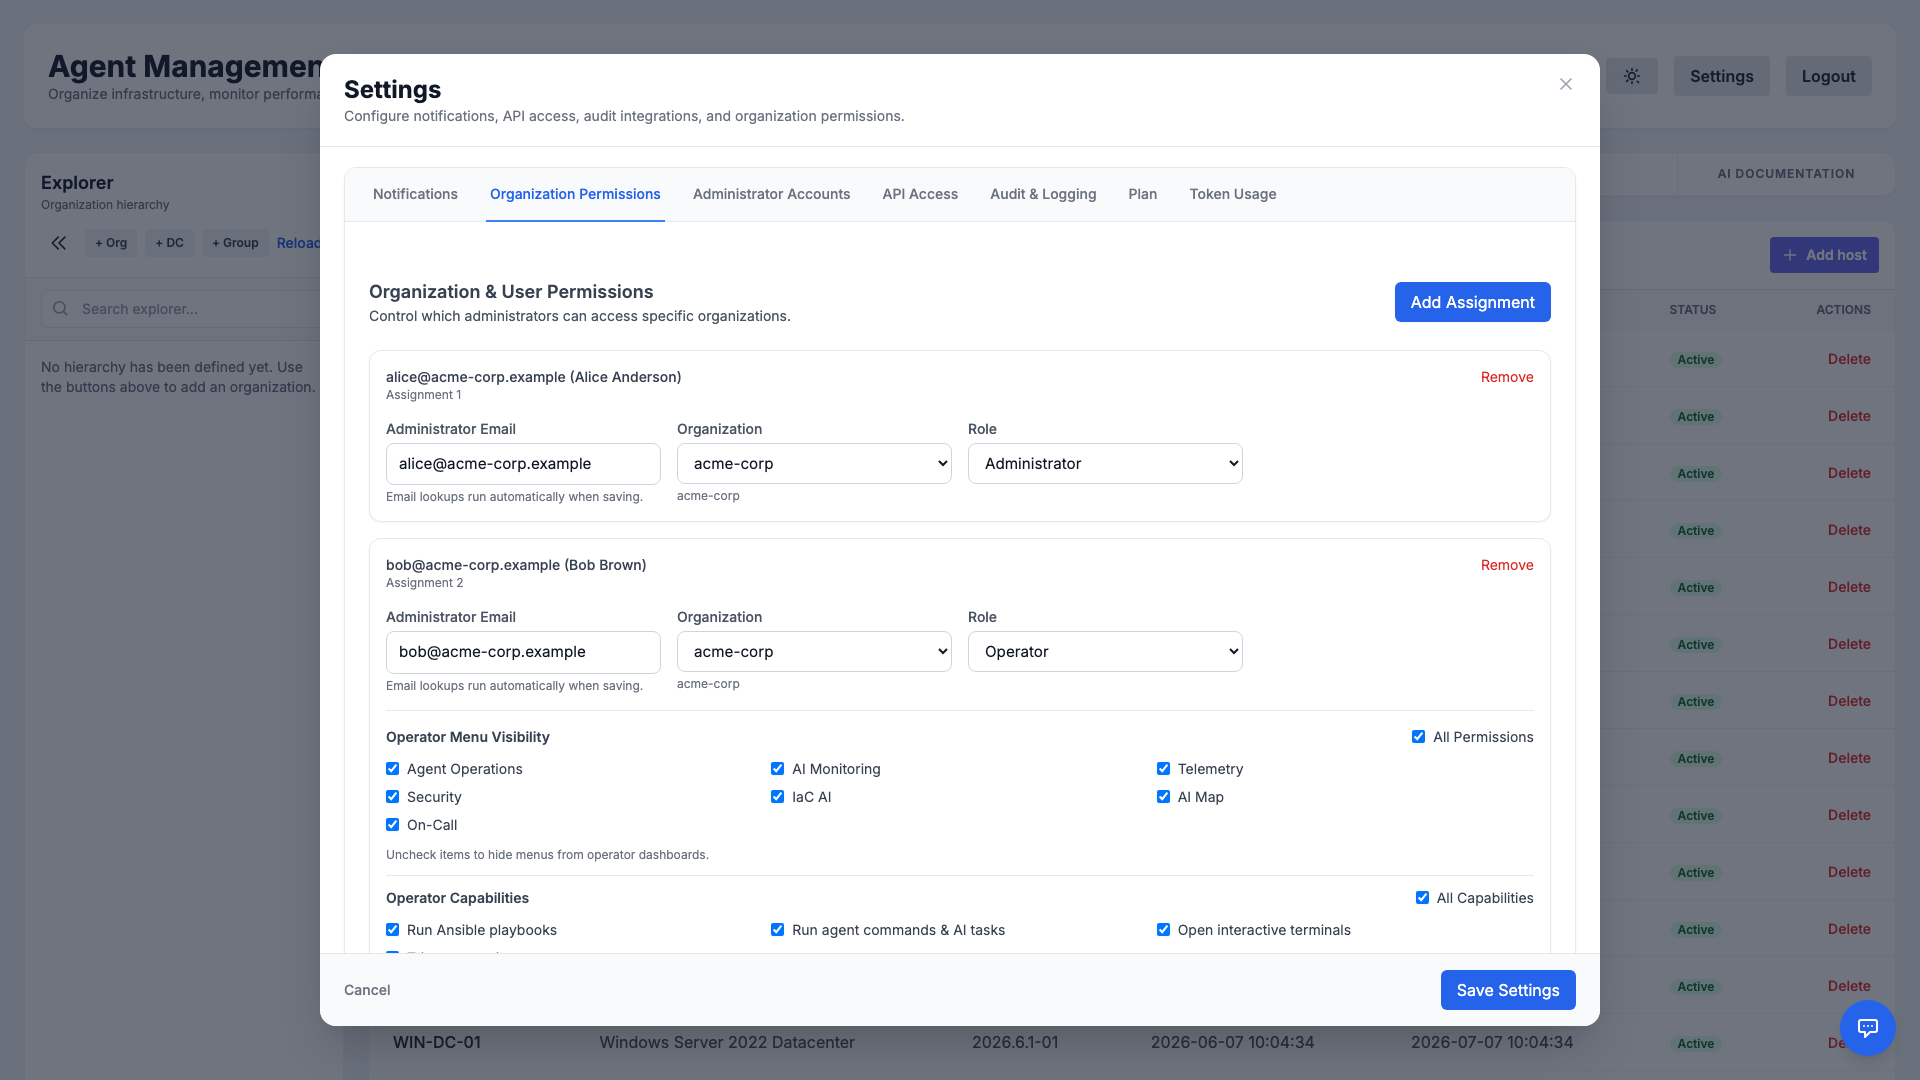
- Granular control: Toggle access to features such as command execution, remediation, security scanning, and settings.
- Least privilege: Give operators only the permissions they need, reducing the blast radius of any single account.
- Consistent enforcement: The same rules apply whether a user works in the UI or via the API.
Administrator Accounts
Manage the people who can access your organization from Settings → Administrator Accounts. Invite teammates, assign roles, and review existing administrators in one place.
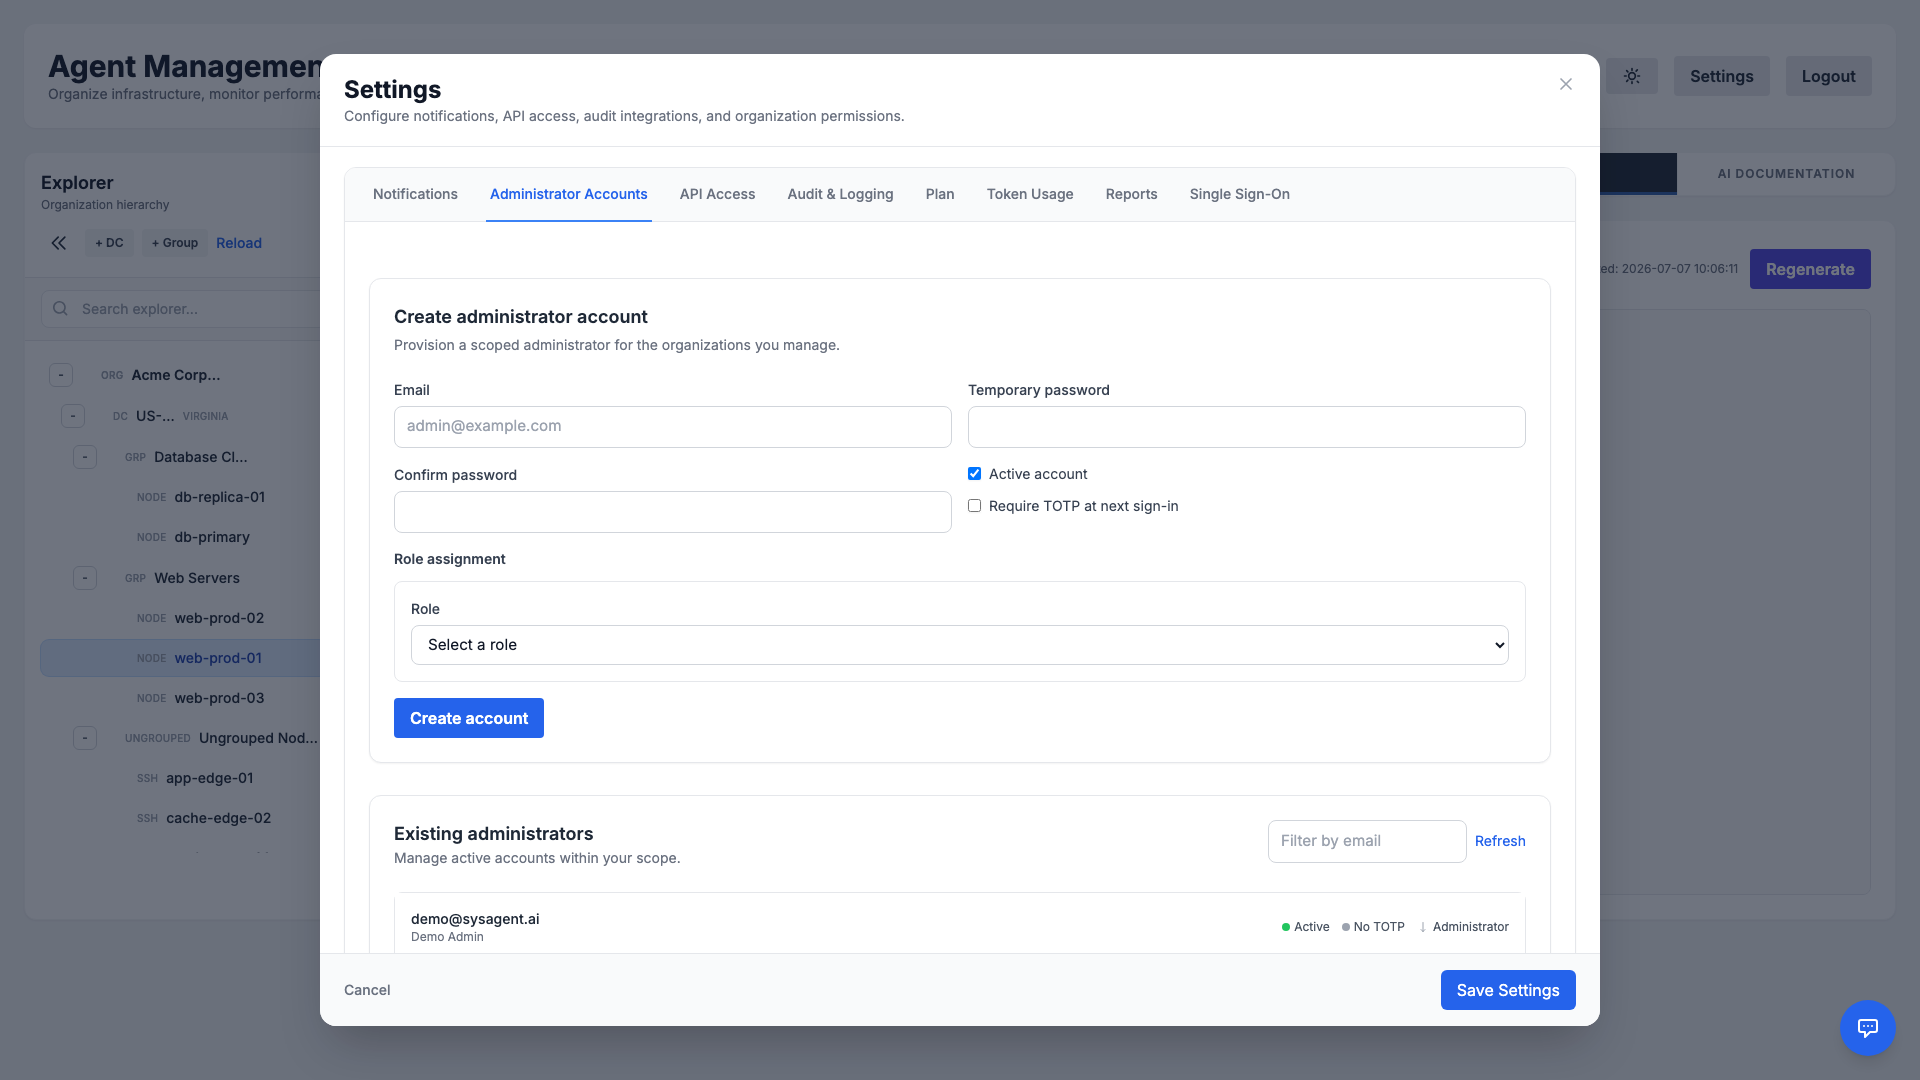
Each account can be granted a specific role — from full master administrator to a scoped operator — with permissions enforced consistently across the dashboard and API.
Audit Log
Maintain a complete, tamper-evident record of activity across your organization. The Audit & Logging tab captures who did what and when — from logins and command executions to configuration changes.
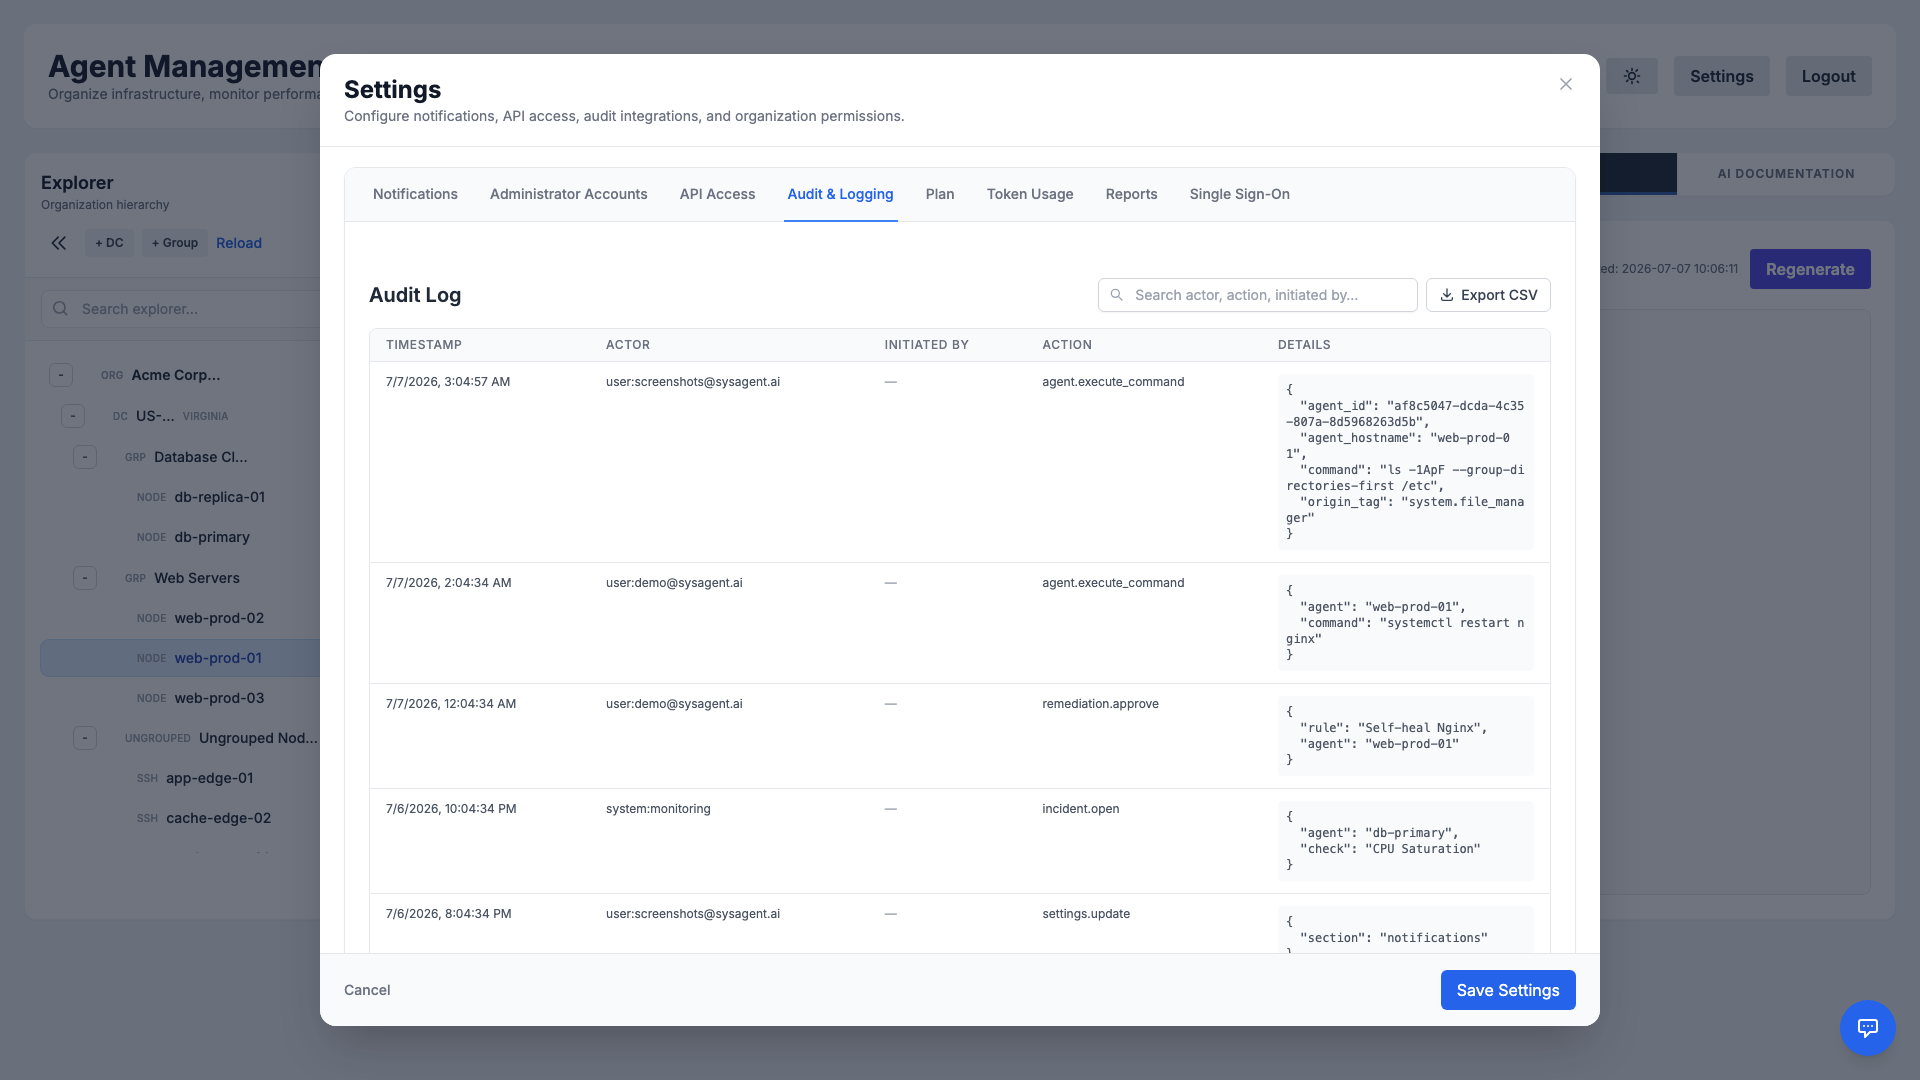
Audit events can also be forwarded to an external SIEM, helping you meet compliance requirements and investigate incidents with confidence.
Bring Your Own Key (BYOK)
For maximum privacy and scale, you can use your own AI provider API key (e.g., OpenRouter, OpenAI).
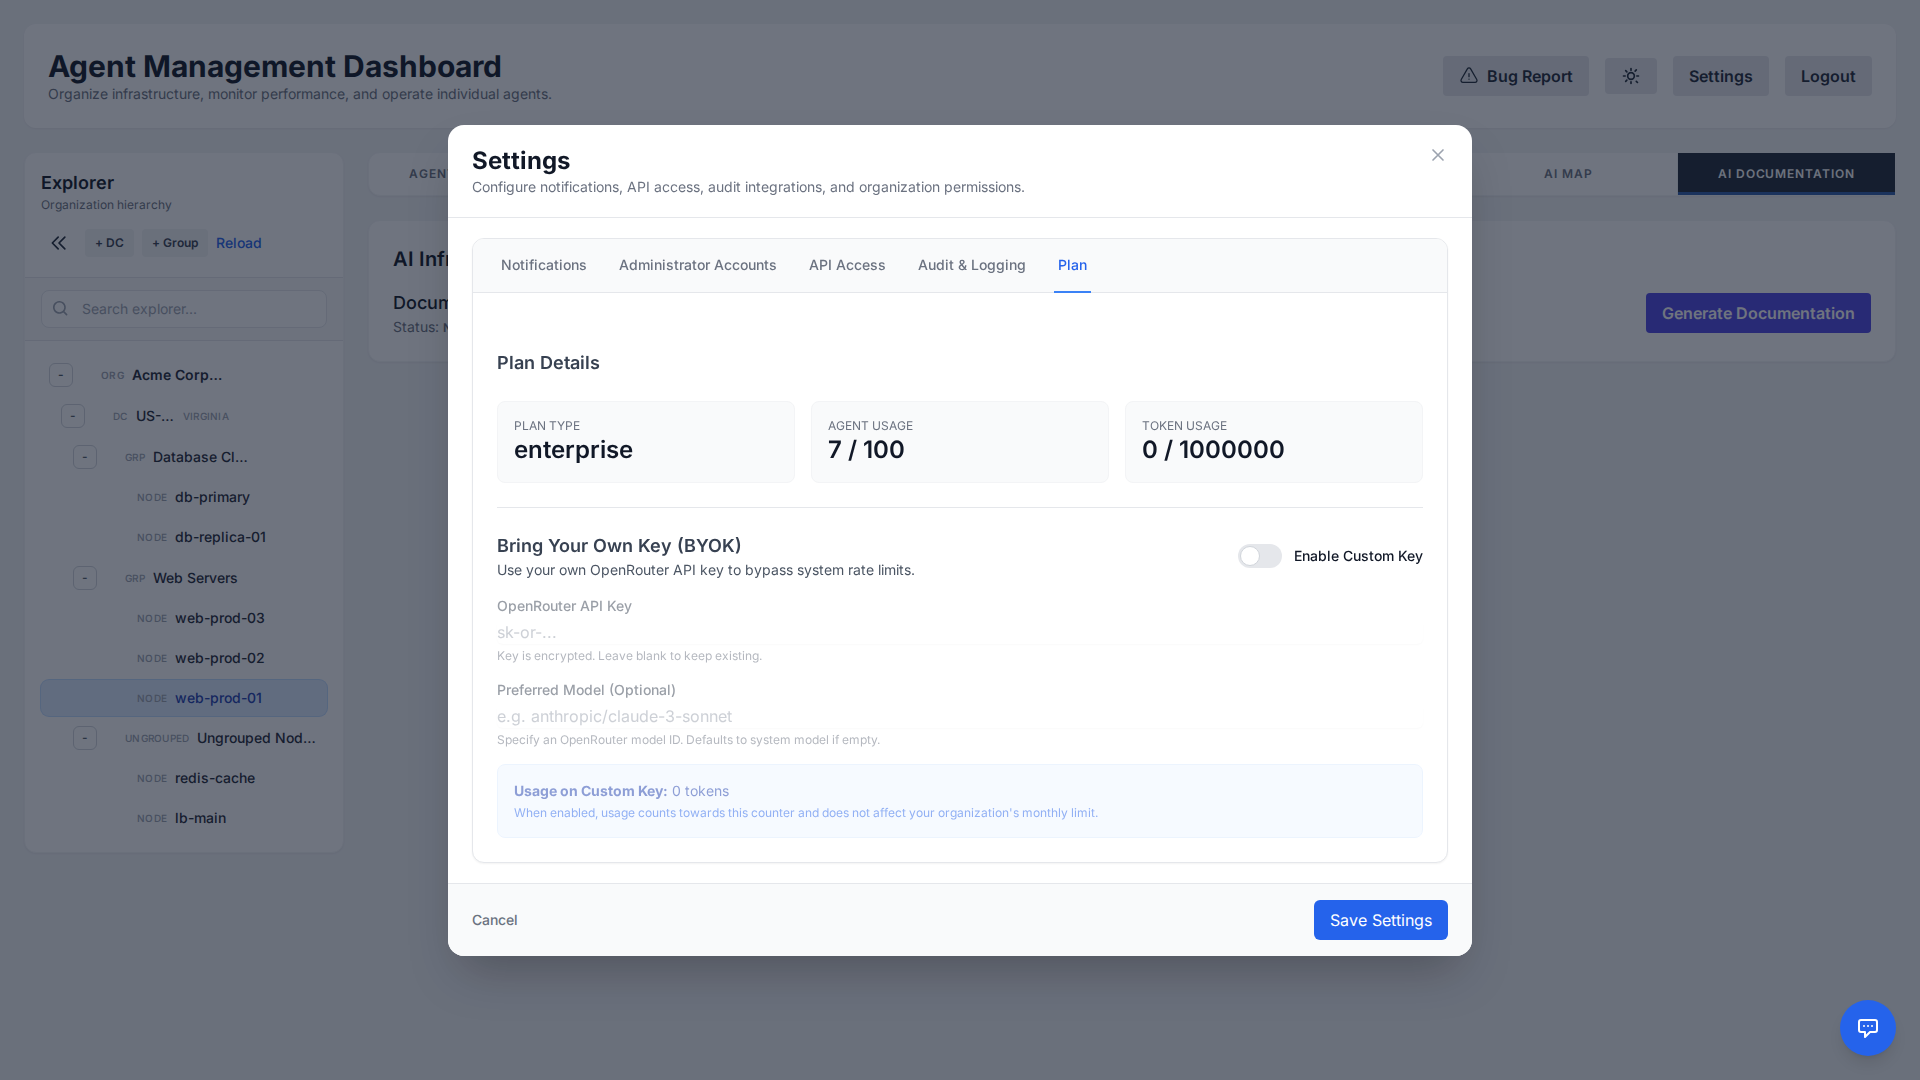
This ensures that:
- Usage is billed directly to your account.
- You get unlimited tokens on our platform (no longer bound by the Free Tier token limit).
- You can use custom models not provided in the default tier.
The key is encrypted at rest using AES encryption before being stored in the database.
Token Usage
Understand and control your AI consumption. The Token Usage tab visualizes how many tokens your organization has used over time, broken down by activity.
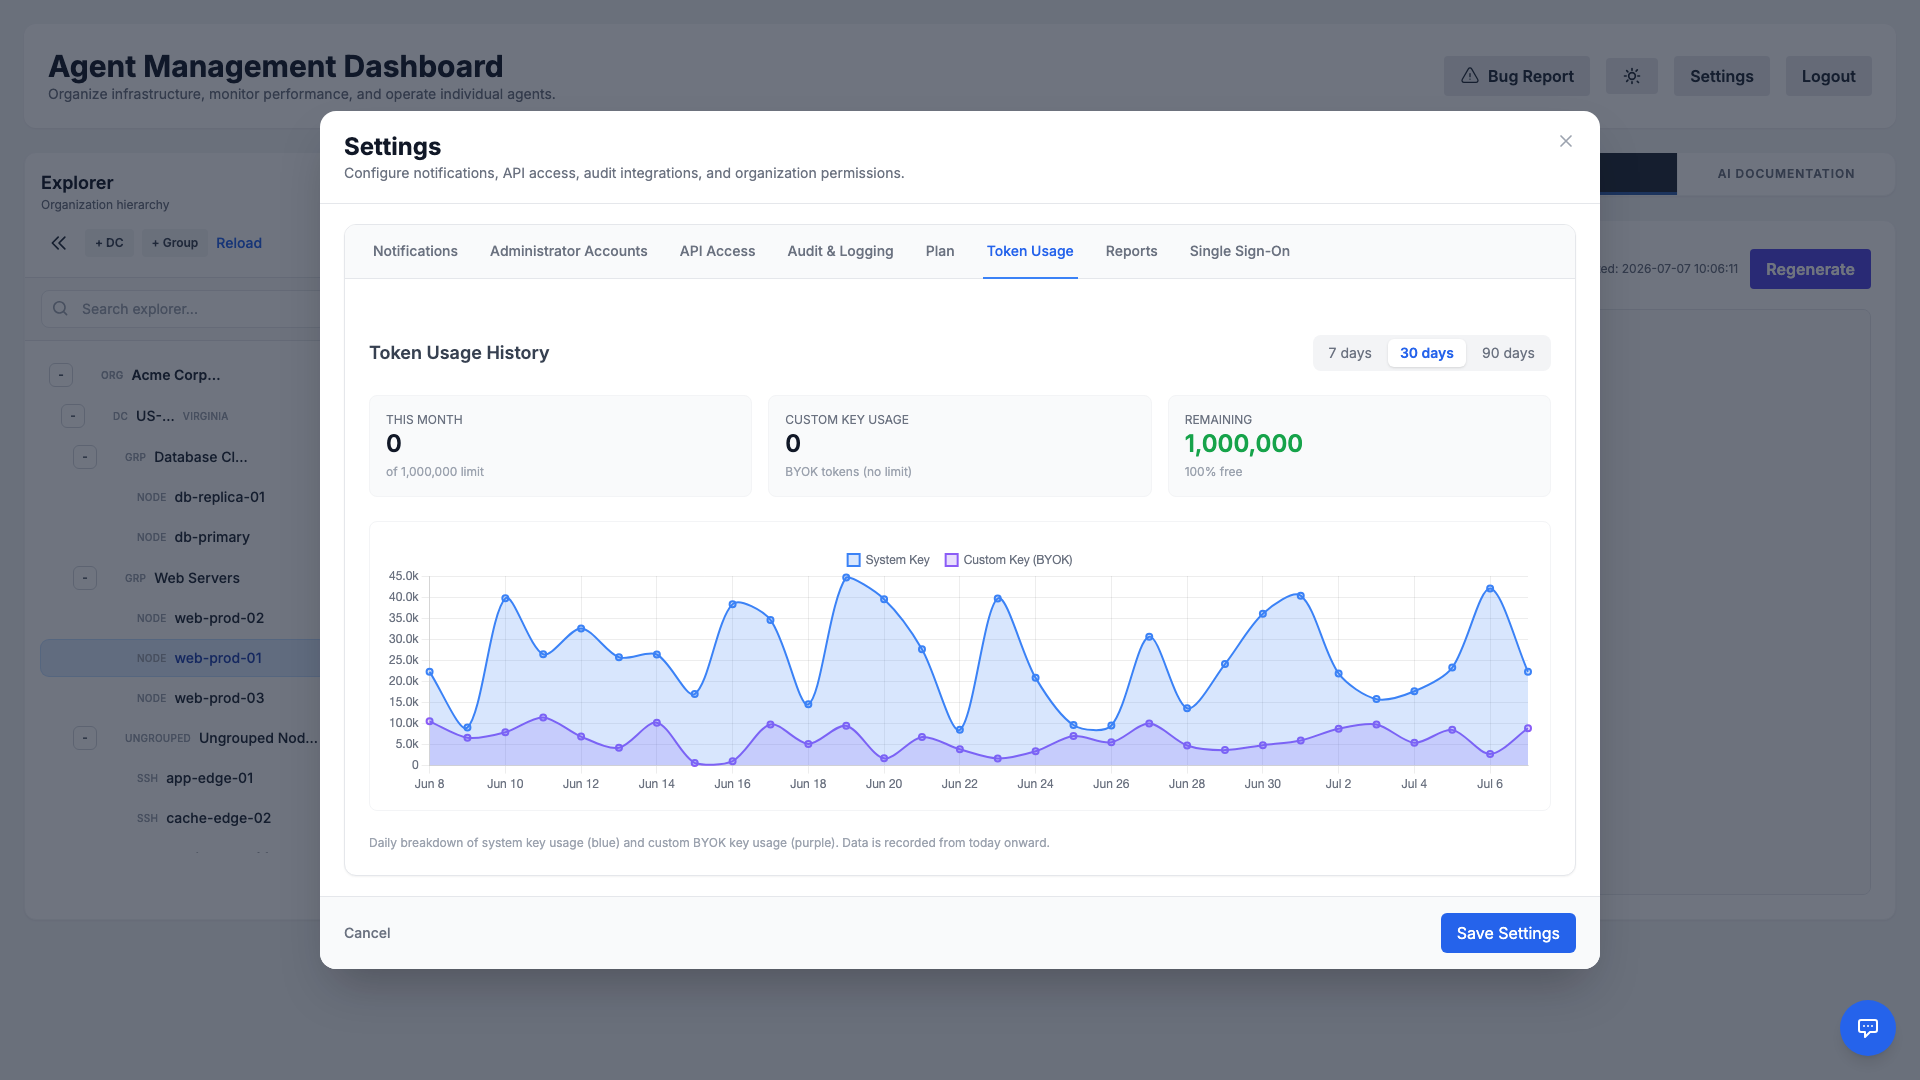
Use these insights to forecast costs, spot unusual spikes, and decide whether to bring your own AI key (see BYOK) for unlimited usage.
Single Sign-On (SSO)
Streamline access and centralize identity with Single Sign-On. Administrators can connect the platform to an external identity provider so users authenticate with your organization's existing credentials.
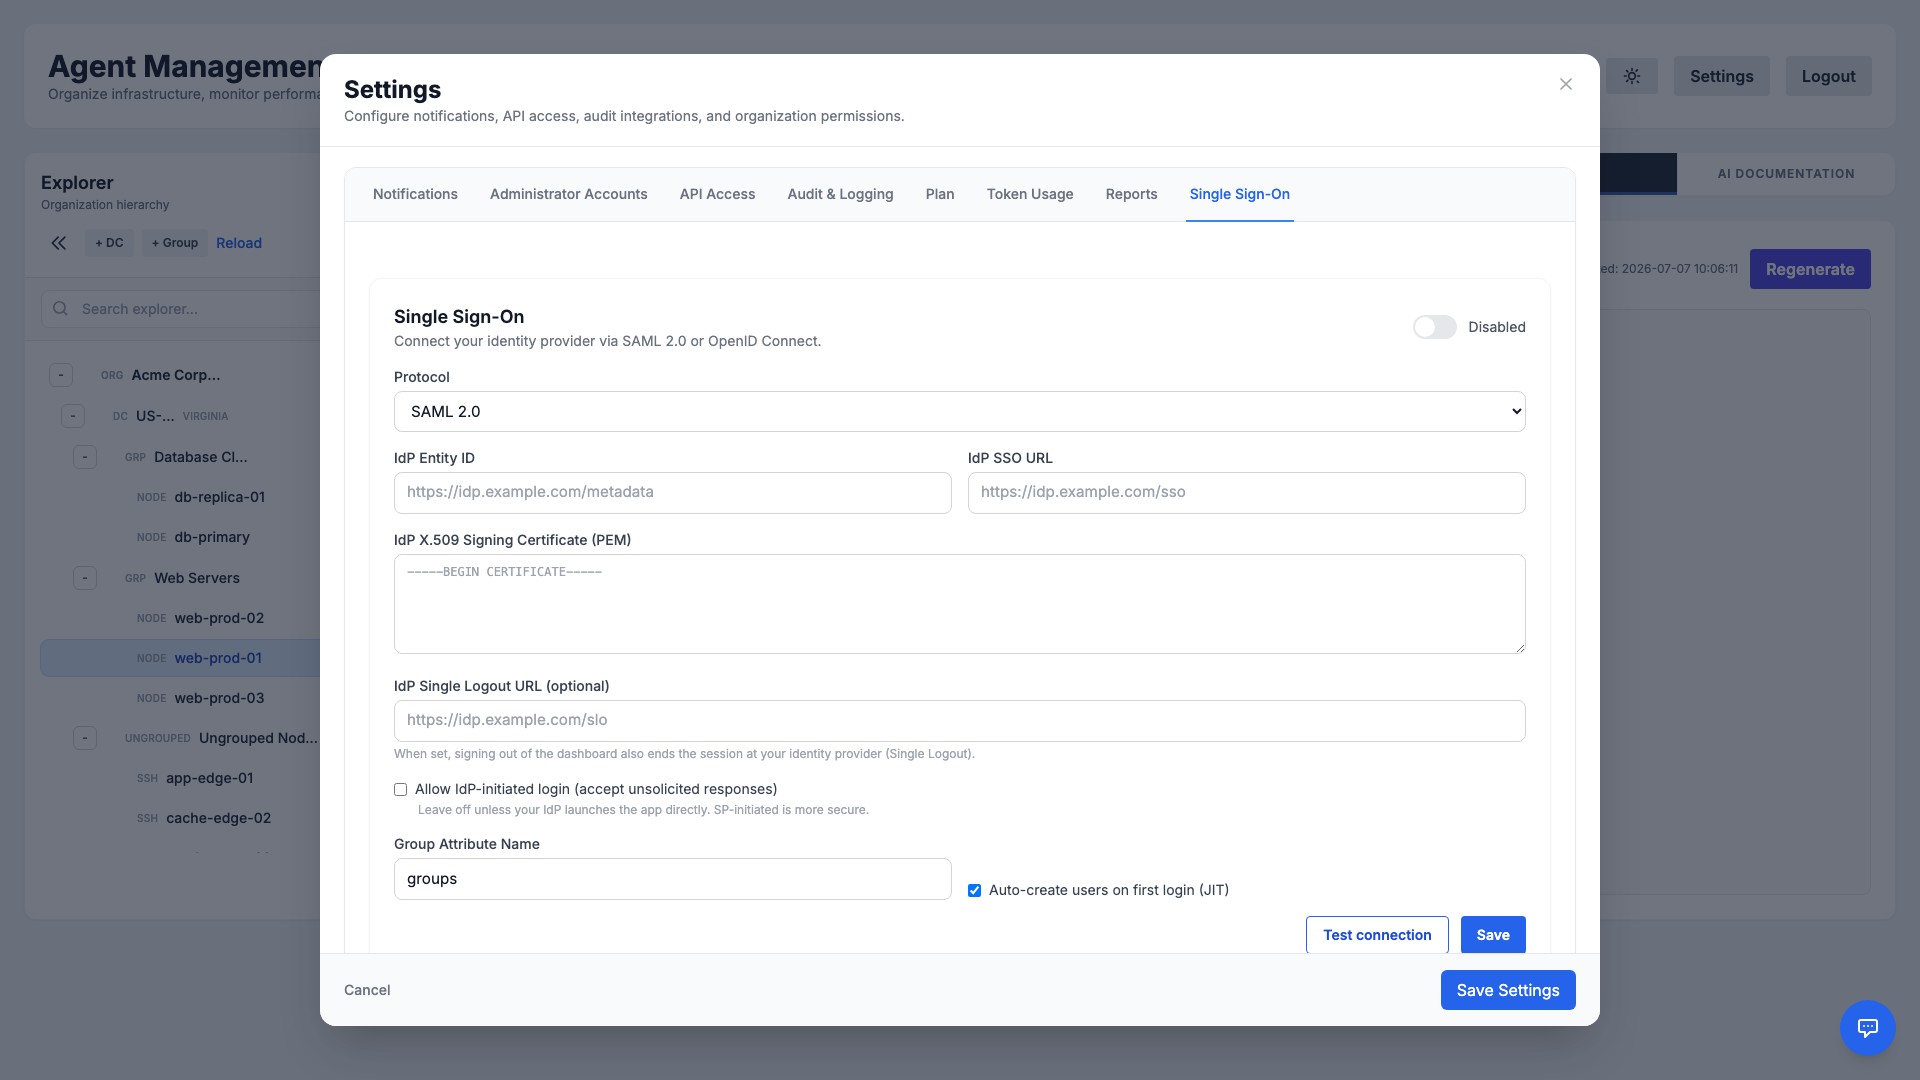
SSO reduces password sprawl, enforces your organization's authentication policies, and simplifies onboarding and offboarding of team members.
Agent Auto-Update
The agent is designed to be self-maintaining. It automatically checks for updates every 5 minutes.
Update Process
- Check: The agent polls the central server for a new version.
- Download: If an update is found, it securely downloads the package over HTTPS.
- Verify & Install: Dependencies are checked, and the package is installed automatically (via systemd or Scheduled Tasks).
- Restart: The agent restarts itself to apply the changes seamlessly.
Note: The agent uses a jitter mechanism (random delay) on startup and reconnection to prevent "thundering herd" issues on the server.
Bug Reporting
Encountered an issue? You can report bugs directly from the dashboard or API.
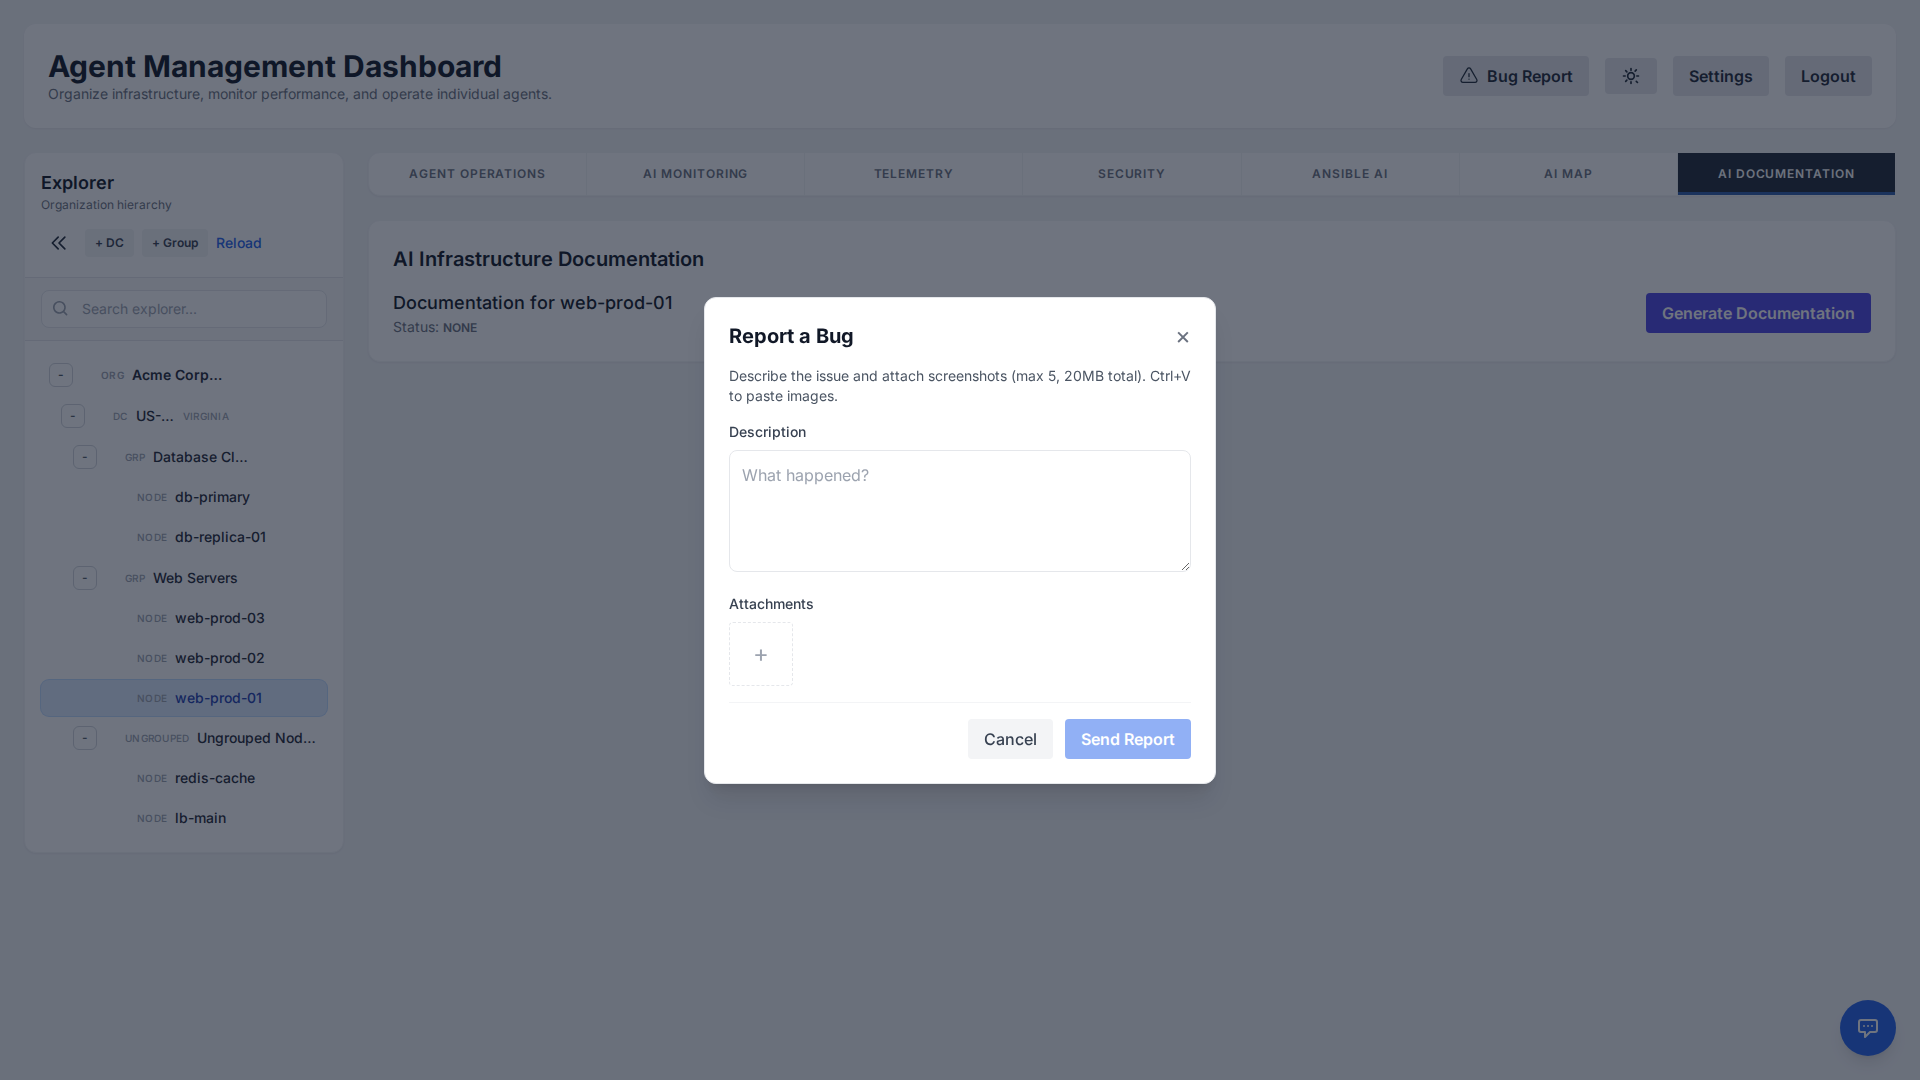
Requirements
- Format: Only image files (screenshots) are accepted.
- Limit: Maximum 5 files per report.
- Size: Total combined size must not exceed 20MB.
Reports are automatically sent to our support team with diagnostic context.
Troubleshooting
Linux Agent not connecting?
- Check if the service is running:
systemctl status ai-linux-agent - View logs:
journalctl -u ai-linux-agent -f - Ensure outbound traffic to port 443 is allowed.
Windows Agent not connecting?
- Check the Scheduled Task "AI System Agent".
- View logs located at
C:\ProgramData\AI System Agent\Logs\agent.log - Ensure outbound traffic to port 443 is allowed and PowerShell scripts are not blocked by strict Execution Policies.